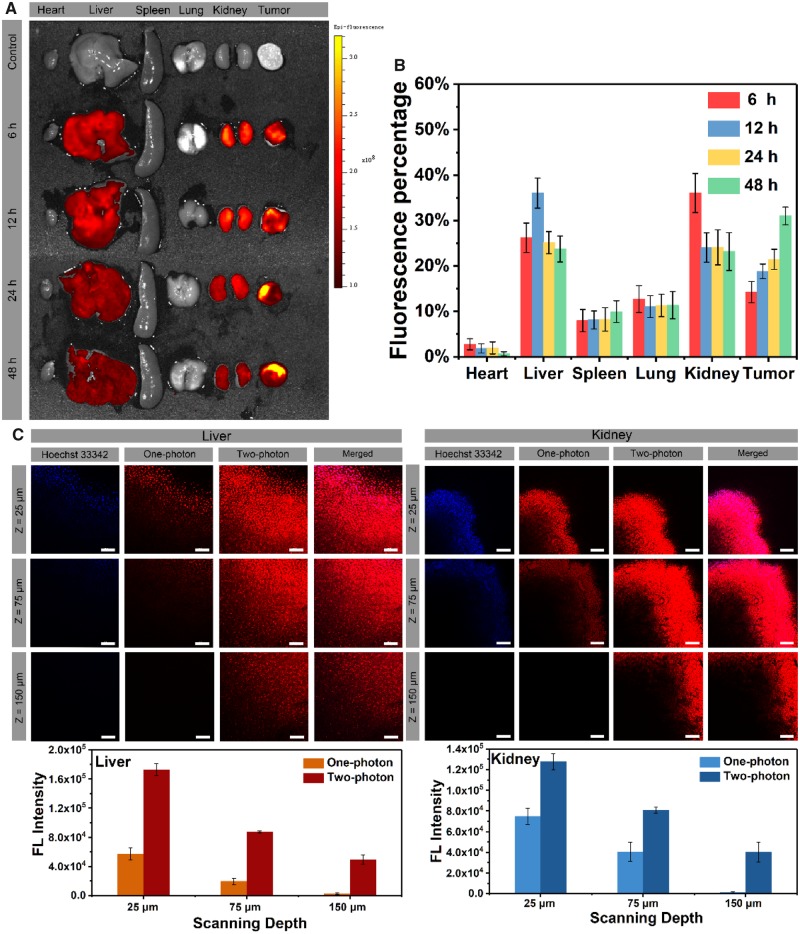
Figure 6.
(A) Fluorescent images of ex vivo mean organs and tumors at different time postinjection. (B) Fluorescent intensity of TP-PEI (DA)-PEG micelles in major organs and tumors. (C) Confocal images and quantitative fluorescence intensity of kidney and liver tissues administrated with micelles for 12 h under two-photon excitation. The scale bars were 100 μm

