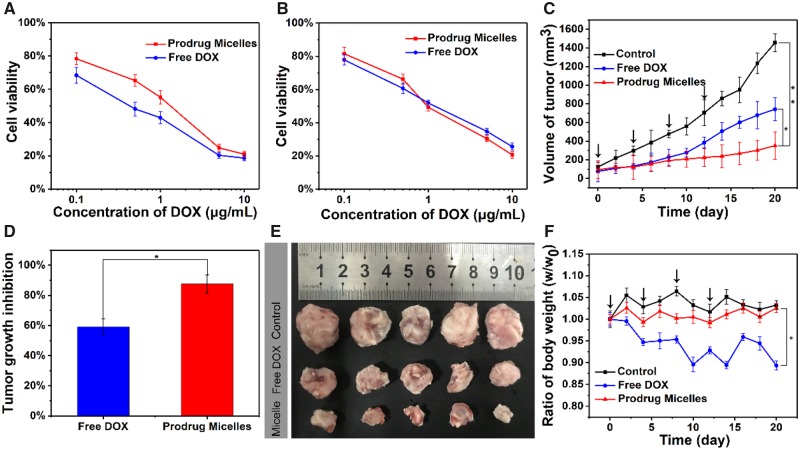
Figure 7.
Cytotoxicity of 4T1 cells co-cultured with different concentrations of free DOX and TP-PEI (DA/DOX)-PEG prodrug micelles at pH 7.4 (A) and 6.8 (B) for 48 h. (C) The volume of tumors treated with saline, free DOX and TP-PEI (DA/DOX)-PEG prodrug micelles over 3 weeks (*P < 0.05, **P < 0.01). (D) The ratio of tumor growth inhibition treated with TP-PEI (DA/DOX)-PEG prodrug micelles and free DOX over 3 weeks (*P < 0.05). (E) The photograph of tumors treated with saline, free DOX and TP-PEI (DA/DOX)-PEG prodrug micelles over 3 weeks. (F) Mice body weights ratio (real-time weight/initial weight), which were treated with saline, free DOX and TP-PEI (DA/DOX)-PEG prodrug micelles in 3 weeks (*P < 0.05; black arrows represented the drug injection)

