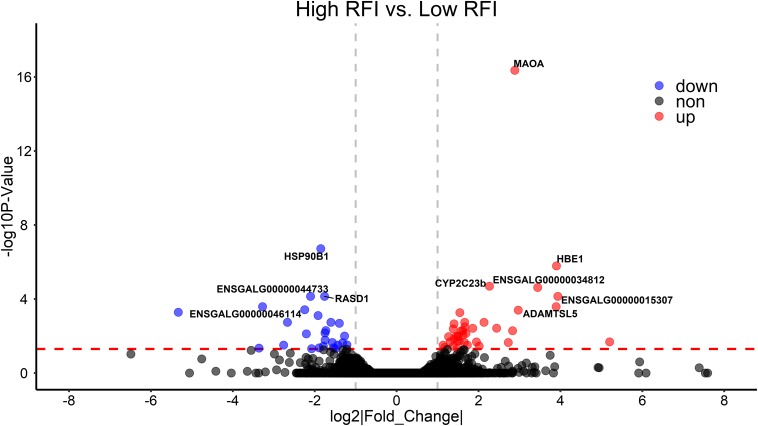
FIGURE 4.
Differentially expressed genes (DEGs) between high- and low-RFI groups in chicken. The volcano plot indicates −log10 (observed P-values) for genes (y-axis) against their corresponding log2(|fold change|) of echo gene (x-axis). The horizontal red dotted line represents the significant threshold (0.05). The red, blue, and gray points represent up-regulated, down-regulated, and non-regulated genes in high-RFI groups, respectively.

