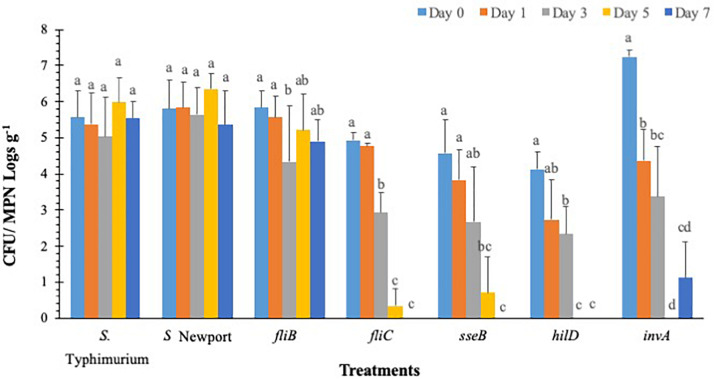
FIGURE 3.
S. Typhimurium populations on lettuce over a 7-day period. Values represent the average of three replications. Standard deviation (±) for surviving S. Typhimurium population (Log10 CFU or MPN g–1) follows mean value. Letters a, b, c shows statistically significant differences (p < 0.05) between sampling days for the same strain.

