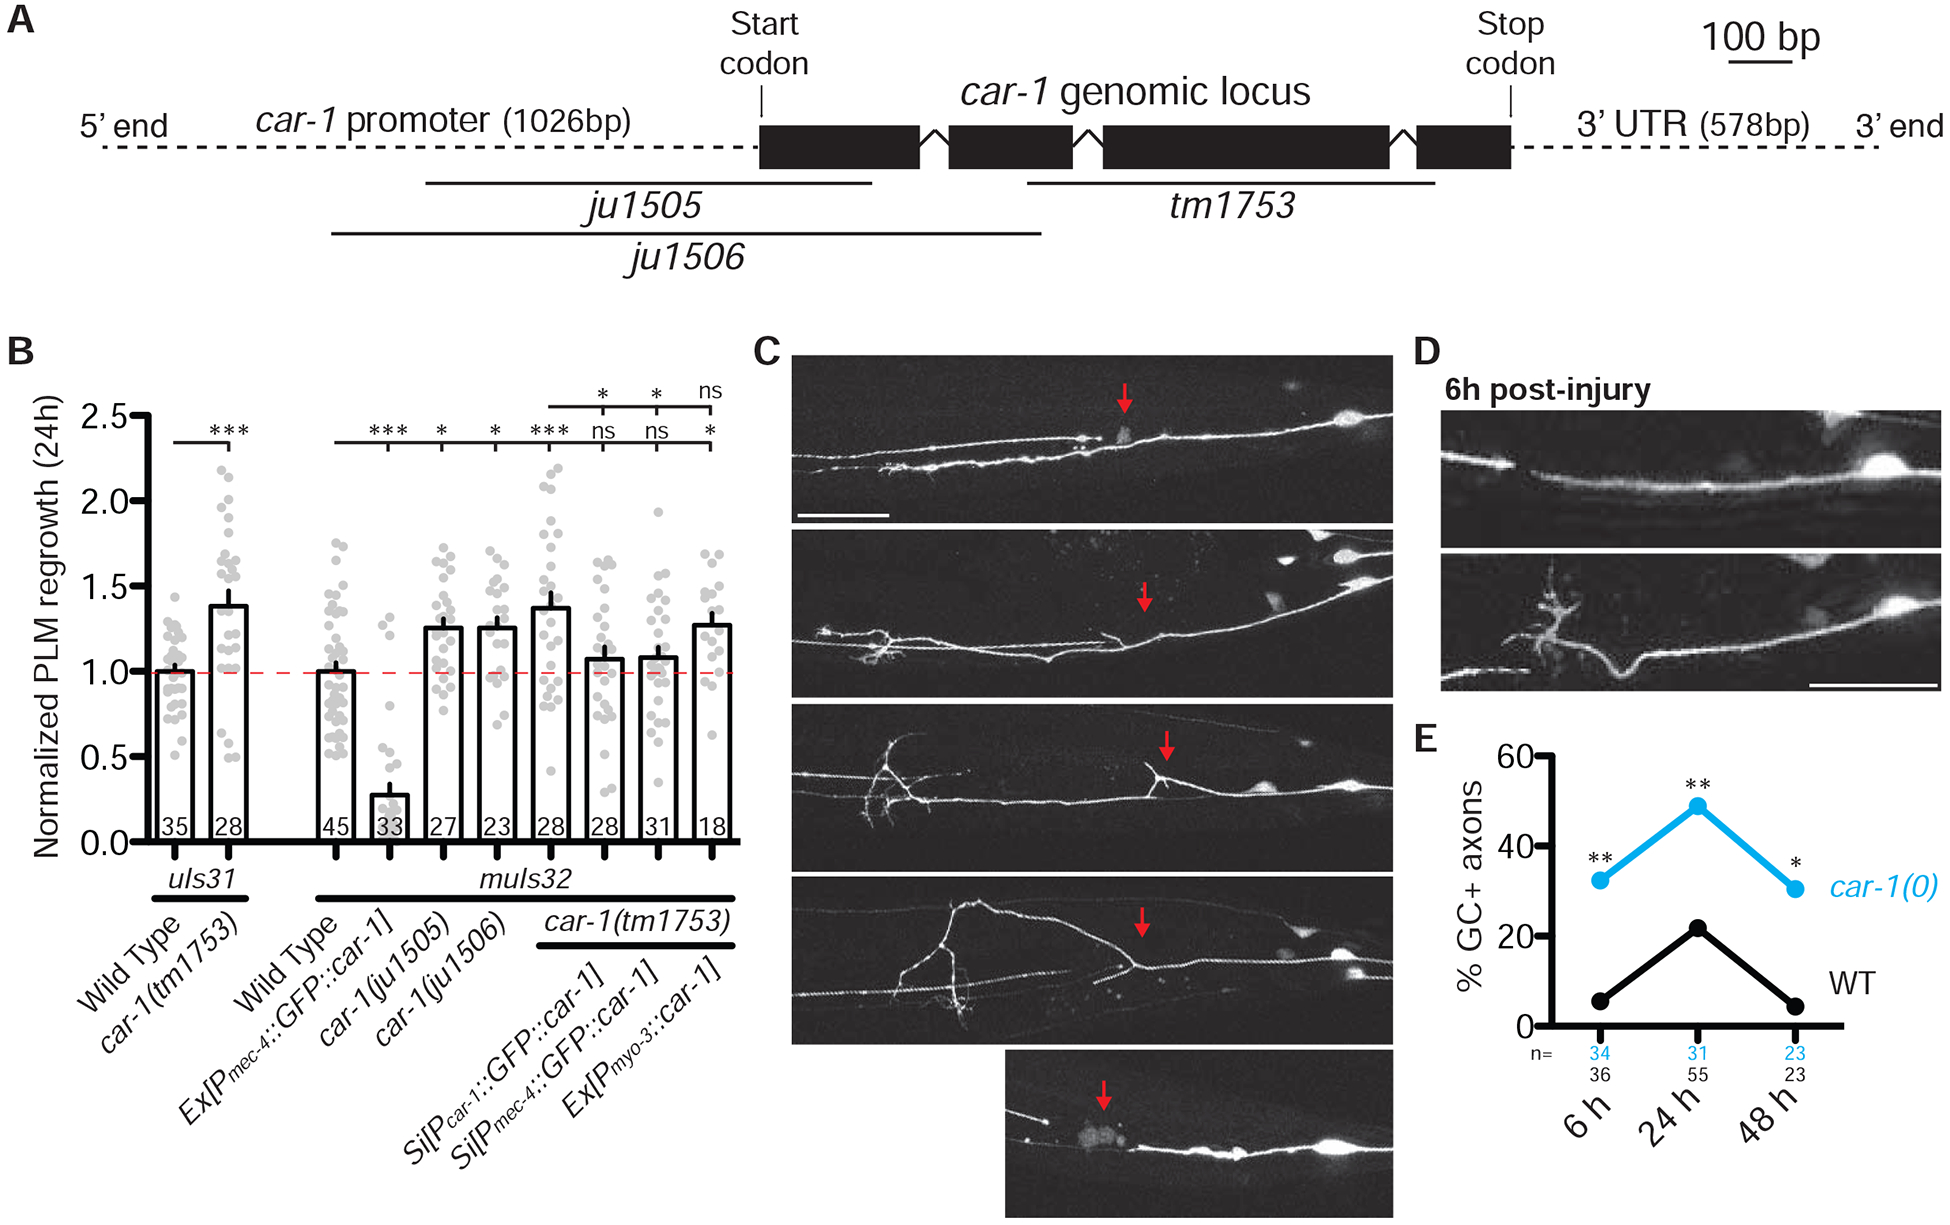
Figure 3. CAR-1 is a cell-intrinsic inhibitor of axon regrowth.

A) Map of car-1 gene showing deletion mutations. See also Table S2.
B) PLM axon regrowth length 24 h post-axotomy in genotype indicated. Bars indicate mean ± SEM. Statistics: one-way ANOVA with Bonferroni’s post test; *p<0.05; ***p<0.001, ns, not significant (P>0.05). Sample size is indicated in the bar.
C) Representative images of axon regrowth 24 h post-axotomy in wild type, car-1(0) mutants and Pmec-4-GFP::CAR-1(juEx7280). Anterior is to the left. Red arrows indicate site of axotomy.
D) Representative images of regrowing axons 6 h post-axotomy in genotype indicated. PLM in car-1(0) mutants has a more persistent regenerative growth cone. Scale bar, 20 μm.
E) Quantitation of % of growth cones at 6, 24 and 48 h post-axotomy. Statistics: Fisher’s exact test; *p<0.05; **p<0.01.
