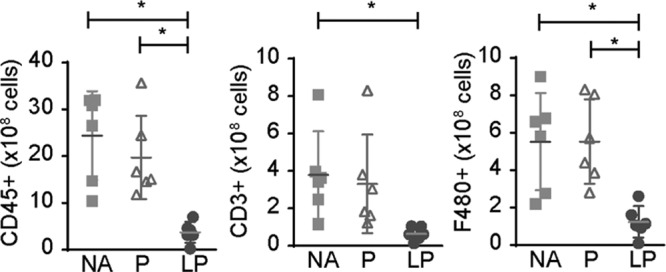
FIGURE 5.

The treatment effect of LP on the cellular infiltrate in the allograft. The influx of CD45+, CD3+, and F4/80+ cells after treatment was determined with FACS and calculated to cell count per whole kidney. CD45+ and F4/80+ infiltrates are reduced after treatment with LP compared with P and NA. CD3+ infiltrates are reduced after treatment with LP compared with NA treatment (mean ± SD. *P < 0.05, **P < 0.01, ***P < 0.001, one-way analysis of variance with a Tukey multiple comparisons test. NA = no additional treatment; N = 6, P = Prednisolone, N = 6, LP = liposomal prednisolone, N = 6).
