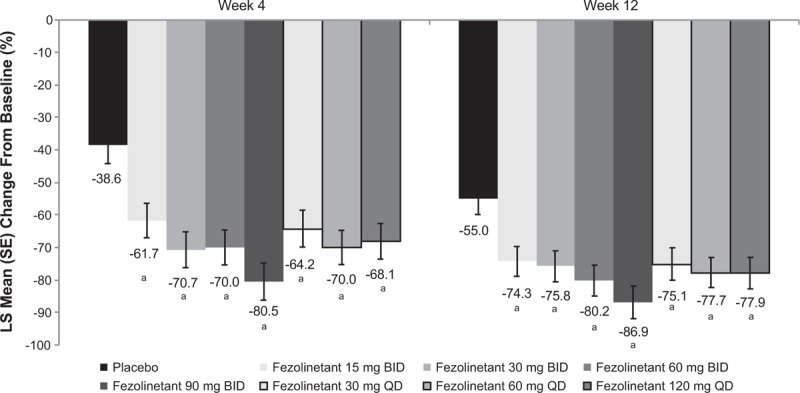
FIG. 3.

LS mean percentage reduction from baseline in frequency of moderate/severe VMS (MMRM), full analysis set. MMRM conducted with treatment group, visit, and smoking status as factors, and baseline measurement, interaction of treatment by week, and interaction of baseline measurement by week as covariates. LS, least squares; MMRM, mixed effect model for repeated measures; VMS, vasomotor symptoms. aP < 0.05 for all pairwise comparisons of fezolinetant versus placebo at weeks 4 and 12, with no adjustments for multiplicity.
