
Figure 5.
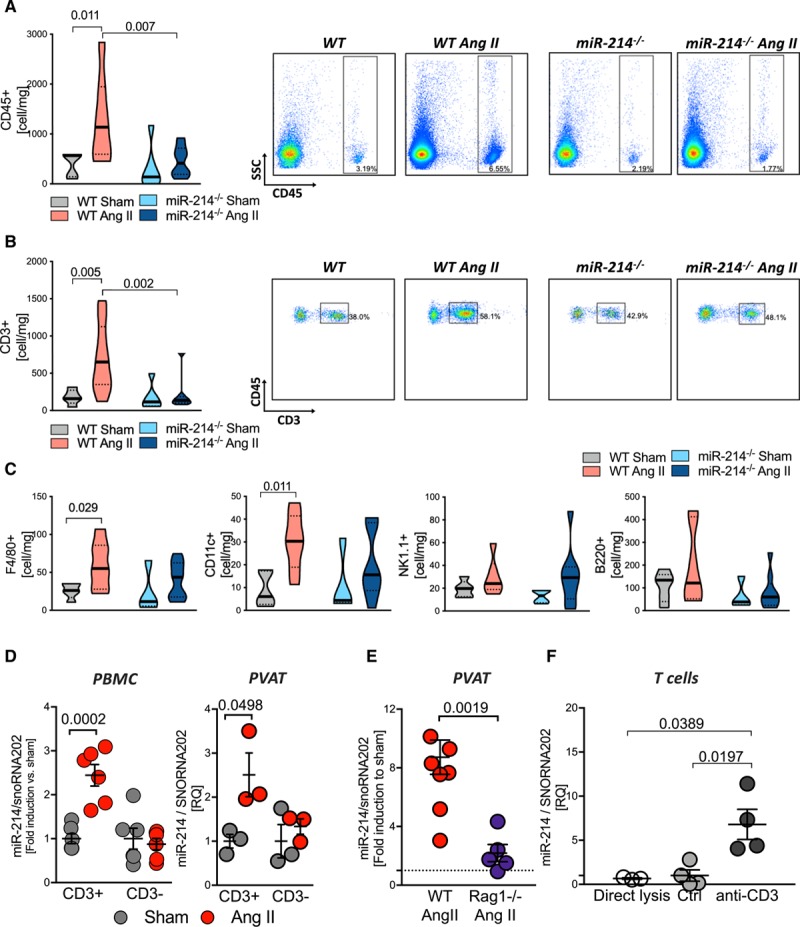
Crucial role of miR-214 in regulation of perivascular inflammation in hypertension. A, Total number of leukocytes and T cells (B) with representative density plots (n=6–9/group). C, Number of perivascular macrophages (F4/80+), dendritic cells (CD11c+), B cells (B220+), and NK cells (NK1.1+) per mg of tissue, studied by flow cytometry (n=5–7/group). Data presented on volcano plots depicting median (__) and quartiles (….). D, miR-214 induction in T cells (CD3+) and remaining leukocytes (CD3−) in Ang II hypertension measured in cells from peripheral blood (left, PBMC n=5–6/group) and from perivascular adipose tissue (PVAT; right, n=3/group of 3 pulled mice). E, MiR-214 level in PVAT of WT and RAG1−/− animals (n=5–7/group). F, miR-214 in quiescent (direct lysis; control mAb) and anti-CD3 mAb activated T cells (n=3–4/group). Data presented as mean±SEM and analyzed by Kruskal-Wallis test (A–C), 2-way ANOVA with Tukey post hoc test (D; P values adjusted for 6 comparisons), t-test (E), and by Kruskal-Wallis test with FDR (F; P values adjusted for 3 comparisons). Overall P values for Kruskal-Wallis; A (P=0.017), B (P=0.011), C (P=0.06), D (P=0.05), and F (0.0001); 2-way ANOVA; D for PBMC (PCD3×AngII=0.0006, PAngII=0.0026, PCD3=0.0006) and PVAT (PAngII=0.024, PCD3=0.115, PCD3×AngII=0.115).