
Figure 7.
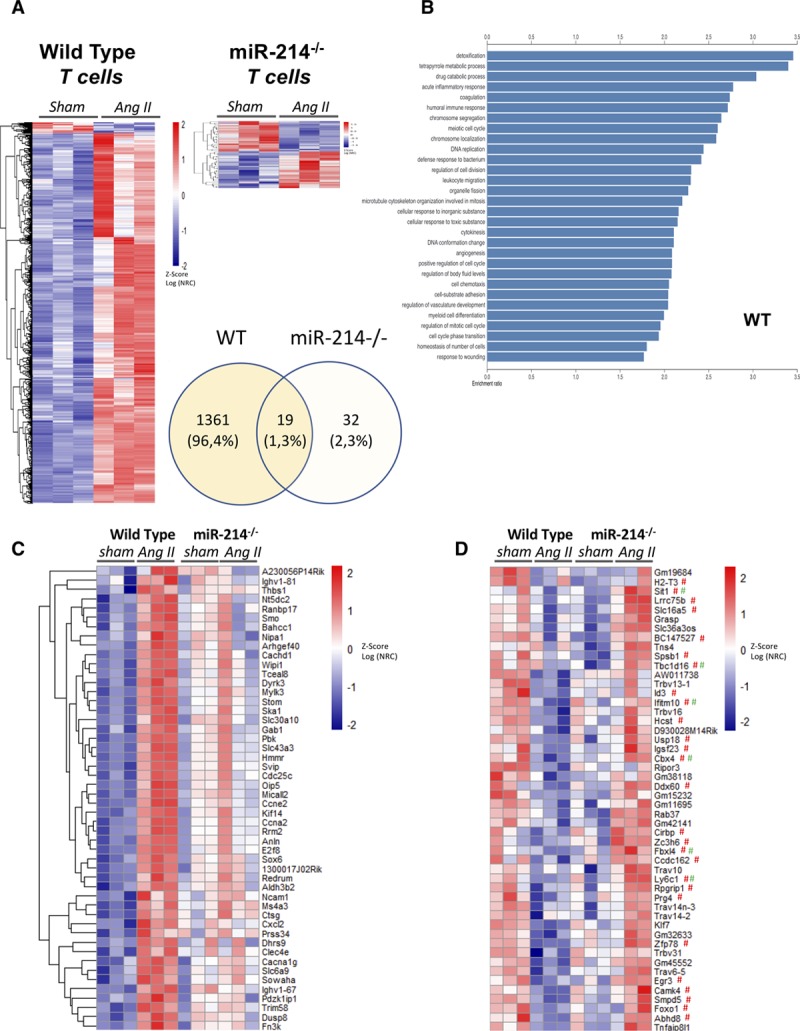
Essential role of miR-214 in T cell responses in Ang II (angiotensin II)-induced hypertension. A, Genes with absolute log2FC>1, significantly (FDR adj P<0.05 calculated using Wald test in DESeq2) changed in T cells following 2-week AngII infusion in vivo in WT (left) and mir214−/− (right) mice (n=3). Venn diagram indicates total numbers of genes changed in each strain of mice in response to Ang II. B, Top 30 pathways significantly upregulated in WT T cells following 2-weeks AngII infusion in vivo in WT mice. C, Top 50 genes (based on interaction term estimate) preferentially induced by Ang II infusion in WT when compared with mir214−/− mice (FDR adj Pinteraction <0.05 for all presented). D, Top 50 genes preferentially repressed by AngII infusion in WT as compared with miR-214−/− mice. Predicted targets of miR-214 for miRWalk (# red) and TargetScan 7.1 (# green). Data on heat maps are presented as z-scores of log transformed, normalized gene read counts (Log NRC) calculated with DESeq2.