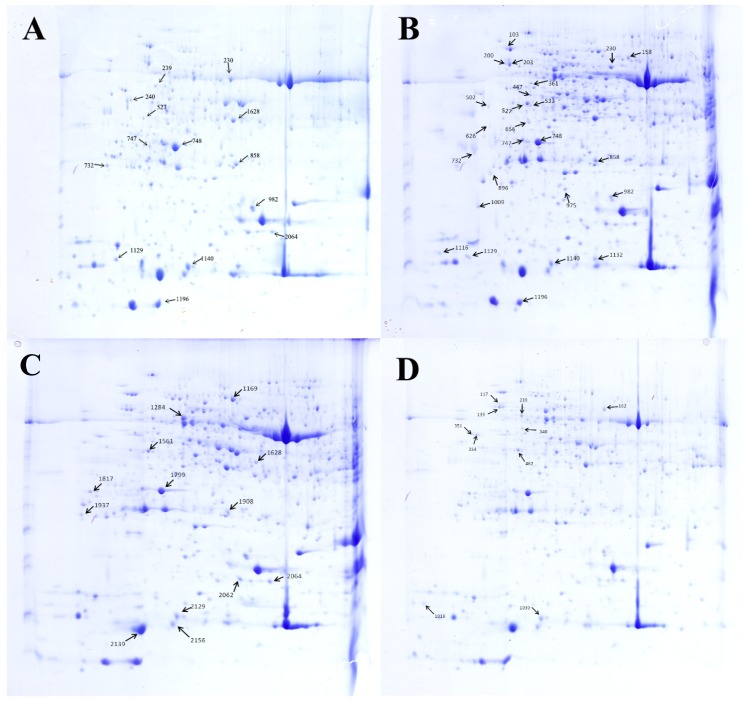
Figure 5. Separation of the total proteins extracted from the explants of cucumber on 2-DE gels over the pH range 4–7.
Each map depicts one representative gel (of three replicates). A total of 48 protein spots showing difference are numbered on the gels. Arrows indicate the protein spots that were positively identified. (A) Control. (B) HRW. (C) Ethephon. (D) HRW + AVG.

