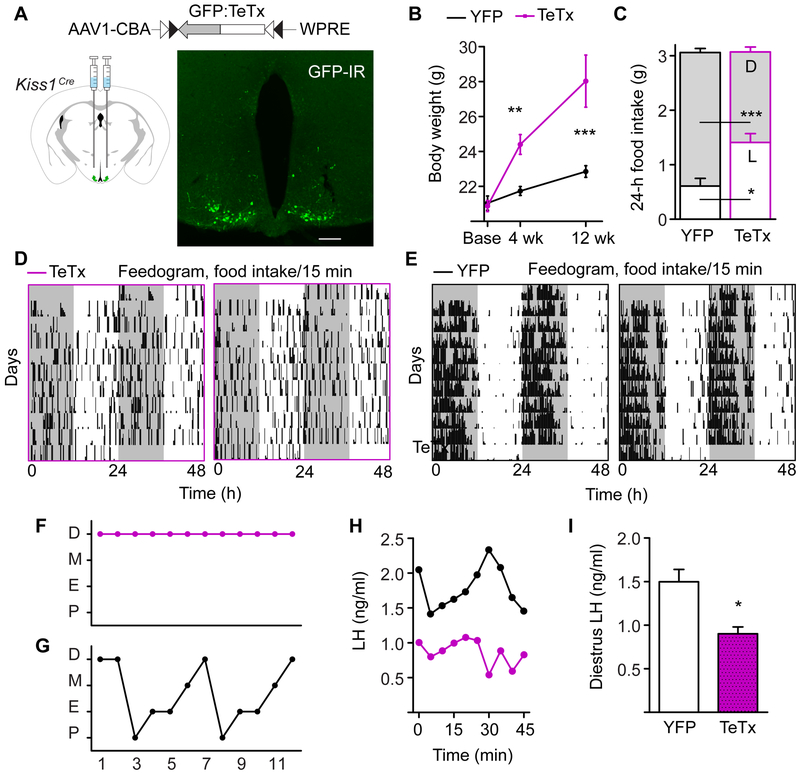
Figure 1. Kiss1ARH-silenced Females are Obese, Do Not Eat More than Controls, but have Arrhythmic Feeding Patterns.
A) AAV1 viral construct containing a GFP-fused TeTx transgene flanked by inverted lox sequences and driven off of the neuron-specific Syn promoter. The virus was injected into the ARH of Kiss1Cre female mice. Fluorescent image of Gfp:TeTx-expressing Kiss1Cre neurons, showing GFP immunoreactivity. Scale bar, 100 μm. Unless otherwise indicated, control mice received an inert AAV1-Ef1a-DIO-YFP reporter virus.
B) Body weight of adult female mice starting from the time of viral injection (base). Two-way ANOVA: n = 20 (TeTx at baseline, 4 wk), n = 20 (YFP at baseline, 4 wk), n = 12 (TeTx, 12 wk), n = 15 (YFP at 12 wk) , F(1,99) = 29.60, p < 0.0001 (main effect of TeTx). Post-hoc, Bonferroni comparisons at each timepoint are indicated on the graph. ** p < 0.01, ***p < 0.001.
C) Average 24-h food intake with light:dark-phase distribution. Two-way ANOVA: n = 8 (TeTx), n = 8 (YFP), F(1, 108)= 82.62, p < 0.0001 (main effect of phase of consumption); F(1, 108) = 0.002, p = 0.97 (main effect of TeTx on total intake); F(1, 108)= 47.82, p < 0.0001 (LD x TeTx interaction).
D and E) Representative feedograms of Kiss1ARH-silenced (D) compared to YFP-injected controls (E). Each line of the feedogram represents 48-h of double-plotted feeding patterns. Each tick is a 15-min bin, and the height of the tick indicates the amount of food consumed within a bin (bin maximum = 0.06 g).
F and G) Representative estrous cycles of TeTx (F) and YFP (G) mice. Cycling data for all of the animals in the study are shown in Figure S1B-D. Abbreviations: P, proestrus; E, estrus; M, metestrus; D, diestrus
H) Matched LH values for the representative mice shown in Figure 1F and 1G (top black line, YFP trace; bottom magenta trace, TeTx).
I) 45-min average values of LH, collected in diestrus. Student t-test: YFP n = 3, LH = 1.50 ± 0.14 ng/ml; TeTx n = 3, LH = 0.90 ± 0.08 ng/ml, t(4) = 3.67, p = 0.021.
See also Figures S1 – S3.

