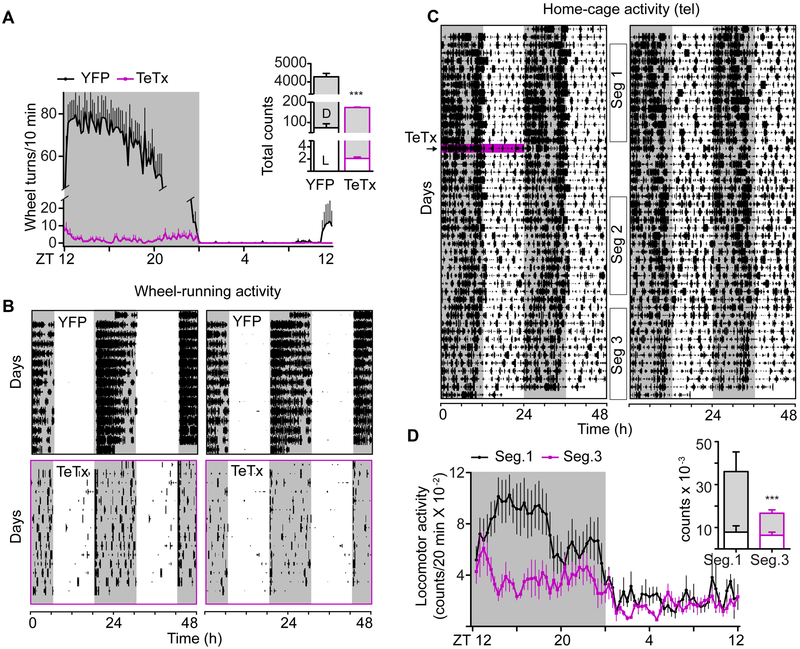
Figure 2. Kiss1ARH Neuron Signaling is Necessary for Robust Dark-phase Locomotor Activity.
A) Waveform of daily running-wheel activity. 3-d average for each mouse. Two-way ANOVA: n = 8 (TeTx), n = 7 (YFP), F(1, 2002) = 57.61, p < 0.0001 (main effect of TeTx); F(143, 2022) = 27.55, p < 0.0001 (group x time interaction). Insert shows the 24-h cumulative wheel activity in the light and dark phases of the L:D cycle. Two-way ANOVA: F(1, 28) = 465.7, p < 0.0001 (main effect of TeTx).
B) Double-plotted actograms of running-wheel activity from two representative mice in each cohort. Note, the activity of Kiss1ARH-silenced mice (bottom, purple boxes) was amplified by a factor of 25X in order to visualize the pattern of wheel-running activity in each 10-min bin.
C) Double-plotted actograms of home-cage activity from two representative mice, recorded with telemetry IP transponders. The pink line indicates the day of viral injection.
D) Waveform of home-cage activity counts (3 d average for each mouse) comparing the Kiss1Cre females before (black, Seg.1) and after viral injection (purple, Seg.3). Two-way rmANOVA: n = 6, F(1, 360) = 230.7, p < 0.0001 (segment effect); F(71, 360) = 3.59, p < 0.0001 (segment x time interaction). Insert shows the 24-h cumulative home-cage activity in the light and dark phases of the L:D cycle. Two-way ANOVA: F(1, 10) = 21.80, p = 0.0009 (main effect of TeTx).
Error bars represent ± SEM. Grey shade indicates the dark phase of the L:D cycle. See also Figures S2 and S3

