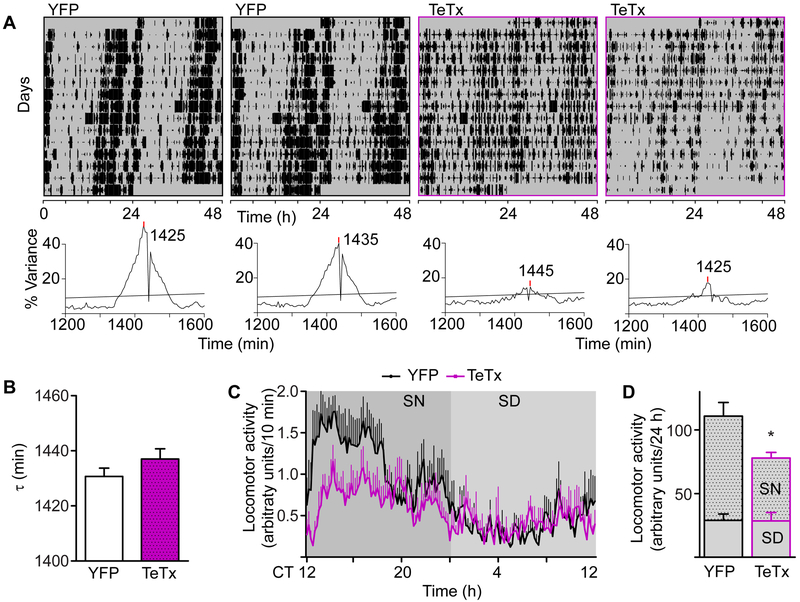
Figure 3. Circadian Home-cage Activity of Kiss1ARH-silenced Mice Shows Decreased Amplitude.
A) Representative actograms of home-cage activity (tracked with infrared beams) from two mice in each cohort, double plotted. Corresponding χ2 periodograms are shown below each actogram. Statistical significance (p = 0.05) is shown as a horizontal line.
B) Average period (t) of home-cage free-running locomotor activity comparing YFP-injected controls to Kiss1ARH-silenced females. Student t-test: YFP n = 7, t = 1431 ± 7.87 min; TeTx n = 5, t = 1437 ± 8.37 min, t(10) = 1.33, p = 0.21.
C) Waveform of daily activity. 5-d average was calculated based on the free-running period of each mouse. CT 12:00 was aligned with the onset of activity. We assumed the subjective night to be from CT 12:00-0:00 (12 circadian hours). Two-way ANOVA: YFP (n = 7), TeTx (n = 5); F(1, 1430) = 6.36, p = 0.03 (main effect of TeTx).
D) Cumulative 24-h activity counts, grouped into subjective day (SD) and night (SN). Student t-test comparison: YFP n = 7, t = 110.9 ± 26.45 min; TeTx n = 5, t = 77.92 ± 14.27 min, t(10) = 2.52, p = 0.030.
See also Figure S2 and S3

