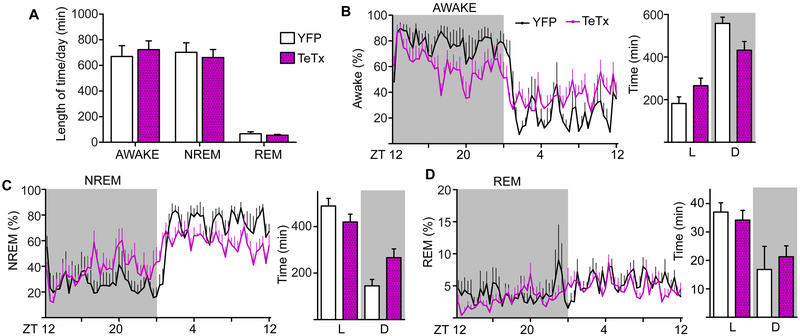
Figure 5. Sleep-wake Patterns are Influenced by Kiss1ARH Neuron Transmission in L:D.
A) 24-h average of wakefulness, NREM and REM sleep states. 48 h of recording was scored and averaged for each animal. Two-way ANOVA: YFP (n = 5), TeTxLC (n = 8); F(1, 36) = 0.00016, p = 0.99 (main effect of TeTx silencing); F(2, 36) = 0.33, p = 0.72 (group x sleep state interaction).
B) Waveform of the average % time spent awake comparing Kiss1ARH-silenced and YFP controls. Two-way ANOVA: YFP (n = 5), TeTx (n = 8); F(71, 781) = 2.89, p < 0.0001 (group x time interaction). Total wake time per phase, two-way ANOVA F(1, 22) = 10.37, p = 0.004; (group x LD interaction).
C) Waveform of the average % time spent in NREM comparing Kiss1ARH-silenced and YFP controls. Two-way ANOVA: YFP (n = 5), TeTx (n = 8); F(71, 781) = 3.00, p < 0.0001 (group x time interaction). Total NREM sleep time per phase, two-way ANOVA F(1, 22) = 11.90, p = 0.002; (group x LD interaction).
D) Waveform of the average % time spent in REM comparing Kiss1ARH-silenced and YFP controls. Two-way ANOVA: YFP (n = 5), TeTx (n = 8); F(71, 781) = 1.09, p = 0.288 (group x time interaction). Total NREM sleep time per phase, two-way ANOVA F(1, 22) = 1.51, p = 0.23; (group x LD interaction).

