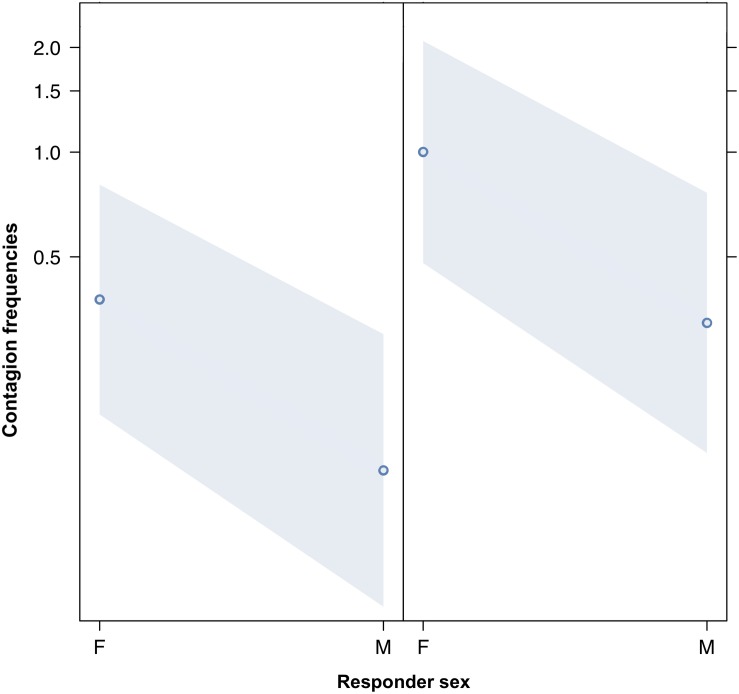
FIGURE 3.
Line plot of the effect of the sex of the responder (X-axis) on acoustic yawn contagion mean occurrence (Y-axis). Effect of the responder sex on acoustic yawn contagion when the trigger is a female (right) or a male (left). Females respond significantly more than males regardless of the sex of the trigger (result of the GLMM, p = 0.021). Points represent the effect that the response variable has on the independent variable “sex of the responder,” based on the value predicted by the model. Colored bands show the 95% confidence interval.

