Figure 1.
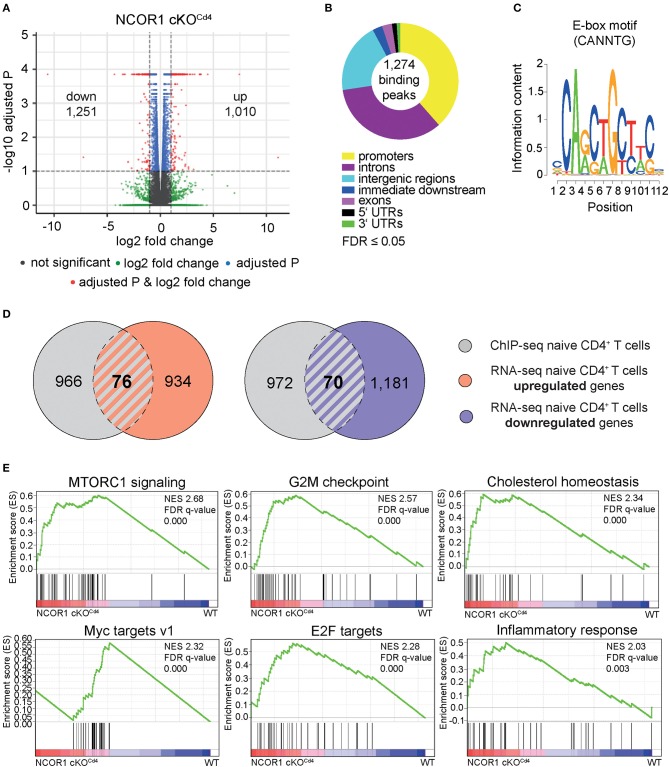
NCOR1-dependent transcriptional profile and NCOR1 target genes in naïve CD4+ T cells. (A) RNA was isolated from naïve WT and NCOR1 cKOCd4 CD4+ T cells and subjected to RNA sequencing. Three independent WT and NCOR1 cKOCd4 CD4+ T cells batches were prepared on the same day. Volcano plot depicts a comparison of global gene expression profiles between naïve WT and NCOR1 cKOCd4 CD4+ T cells. The x-axis displays fold change (log2) and the y-axis indicates P-values (–log10). 1,010 and 1,251 genes were up- and downregulated in NCOR1 cKOCd4 CD4+ T cells (FDR ≤ 0.05 was used as selection criteria). (B) NCOR1 ChIP-sequencing of naïve WT CD4+ T cells revealed 1,274 significant NCOR1 binding peaks. Two independent batches were sequenced. The donut chart shows the distribution of NCOR1 binding peaks across the genome of naïve WT CD4+ T cells (promoters, introns, intergenic regions, immediate downstream, exons, 5′ untranslated regions (UTRs), and 3′ UTRs). The 1,274 binding peaks mapped to 1,042 genes, and this gene list was used for further analysis. (C) Sequence shows DNA-binding motif enriched within NCOR1 recruitment sites as revealed with the Bioconductor rGADEM package. (D) Venn diagrams showing an overlay of NCOR1-bound genes (gray) with genes that are up- (left Venn diagram) and downregulated (right Venn diagram) in NCOR1-deficient naïve CD4+ T cells. (E) Gene set enrichment analysis (GSEA) plots generated from RNA-seq expression data of WT and NCOR1 cKOCd4 naïve CD4+ T cells. Gene sets of the hallmark gene set collection of the Molecular Signature Database (MSigDB) were used. The top 6 enriched hallmark gene sets are shown. A detailed list of differentially expressed genes within these hallmark gene sets is provided in Supplementary Figure 2A. The bar codes indicate the location of the members of the gene set in the ranked list of all genes. FDR, false discovery rate; NES, normalized enrichment score.

