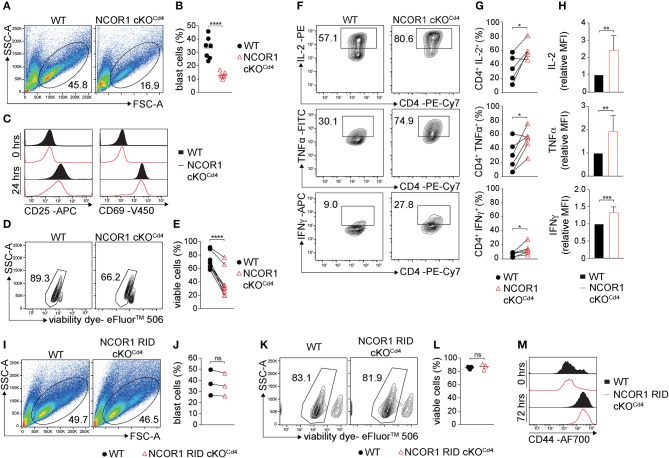
Figure 2.
NCOR1 controls the survival of in vitro-activated CD4+ T cells. (A) Naïve WT and NCOR1 cKOCd4 CD4+ T cells were activated with anti-CD3ε/anti-CD28 and cultured in the presence of recombinant hIL-2 for 3 days (= Th0 condition). Pseudocolor plots show side scatter (SSC-A) vs. forward scatter (FSC-A). Regions indicate T cell blasts. (B) Summary diagram shows the percentage of T cell blasts from all experiments performed as described in (A). (C) Representative histograms depict expression of CD25 (left) and CD69 (right) on WT and NCOR1 cKOCd4 Th0 cells before (0 h; upper histograms) and 24 h (lower histograms) after activation. (D) Representative contour plots of viability dye vs. side scatter (SSC-A) for WT and NCOR1 cKOCd4 Th0 cells. (E) Summary of all experiments performed as described in (D) shows percentages of viable WT and NCOR1 cKOCd4 Th0 cells. (F) Contour plots depict IL-2, TNFα, and IFNγ vs. CD4 expression in WT and NCOR1 cKOCd4 Th0 cells. (G) Summary showing results of all experiments as described in (F). (H) Summary graphs depicting cytokine expression levels as mean fluorescence intensity (MFI). For each experiment, WT levels were set as 1 and relative MFI of IL-2, TNFα, and IFNγ are shown. (I) MACS-purified naïve WT and NCOR1 RID cKOCd4 CD4+ T cells were activated as described in (A). Pseudocolor plots show side scatter (SSC-A) vs. forward scatter (FSC-A) for WT and NCOR1 RID cKOCd4 Th0 cells. (J) Summary diagrams of all experiments performed as described in (I) showing the percentages of WT and NCOR1 RID cKOCd4 Th0 blast cells. (K) Contour plots of viable WT and NCOR1 RID cKOCd4 Th0 cells. (L) Percentages of viable WT and NCOR1 RID cKOCd4 Th0 cells from all experiments as described in (K). (M) Representative histograms depict expression of CD44 on WT and NCOR1 RID cKOCd4 Th0 cells before (0 h, upper histograms) and 72 h (lower histograms) after activation. (B,L) The horizontal bars indicate the mean. *P < 0.05, **P < 0.01, ***P < 0.001, ****P < 0.0001, ns, not significant (unpaired two-tailed t-test or paired t-test for E,G,J). (A,D,F,I,K) Numbers indicate the percentage of cells in the respective regions. (E,G,J) Lines indicate paired experiments. Data are representative (A,C,D,F,I,K,M) or show summary (B,E,G,H,J,L) of 7 (B), 3 (J,L), 8 (E), and 5–6 (G,H) samples that were analyzed in 3–8 independent experiments.

