Figure 3.
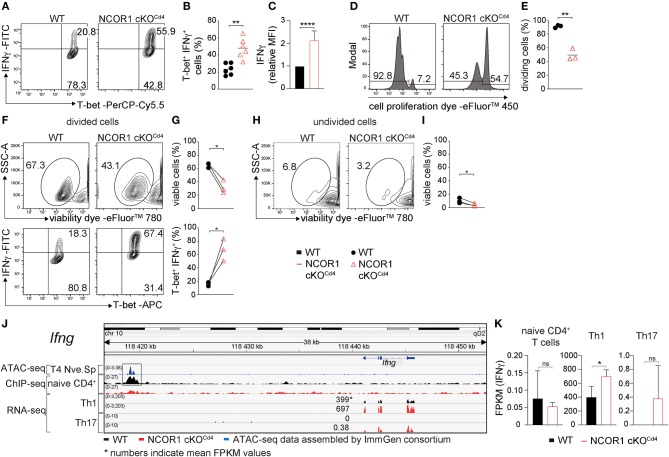
Enhanced IFNγ expression in NCOR1-deficient Th1 cells. (A) Naïve WT and NCOR1 cKOCd4 CD4+ T cells were activated with anti-CD3ε/anti-CD28 for 3 days in the presence of Th1-inducing cytokines. Contour plots depict T-bet and IFNγ expression. (B) Summary of all experiments performed as described in (A). (C) Summary graph of mean fluorescence intensity of IFNγ expression levels. For each experiment, WT levels were set as 1 and relative IFNγ levels were calculated. (D) Representative histograms depict proliferation. Regions mark divided (left) and undivided cells (right). (E) Diagram showing the percentages of cells that underwent at least one cell division. (F) Contour plots in the upper panel show viability dye vs. side scatter (SSC-A) for WT and NCOR1 cKOCd4 Th1 cells with at least one cell division (left region in D). The lower contour plot panel depicts T-bet and IFNγ expression within proliferated WT and NCOR1 cKOCd4 Th1 cells. (G) Summary shows percentages of viable cells (upper graph) and percentages of T-bet+IFNγ+ cells (lower graph). (H) Contour plots show viability dye vs. side scatter (SSC-A) for WT and NCOR1 cKOCd4 Th1 cells of undivided cells (right region in D). (I) Summary shows percentages of viable undivided cells. (J) Integrative Genomics Viewer (IGV) (34, 35) screen shot displaying the Ifng gene locus. ImmGen consortium ATAC-seq peaks (GSE 100738) of splenic naïve CD4+ T cells are shown in the 1st row. The 2nd and 3rd rows display ChIP-seq tracks from WT and NCOR1 cKOCd4 naïve CD4+ T cells, respectively. Rows 4–7 display RNA-seq tracks from in vitro-generated WT and NCOR1 cKOCd4 Th1 and Th17 cells. (K) Diagrams show the summary of Ifng FPKM values obtained by RNA sequencing of naïve CD4+ T cells, and of in vitro-generated Th1 and Th17 cells. (B,E) The horizontal bars indicate the mean. *P < 0.05, **P < 0.01, ****P < 0.0001, ns, not significant (unpaired two-tailed t-test or paired t-test for G,I). (G,I) Lines indicate paired experiments. (A,D,F,H) Numbers indicate the percentage of cells in the respective quadrants or regions. Data are representative (A,D,F,H) or show summary of 6 (B,C) and 3 (E,G,I,K) samples that were analyzed in 6 (B,C) and 3 (E,G,I,K) independent experiments.

