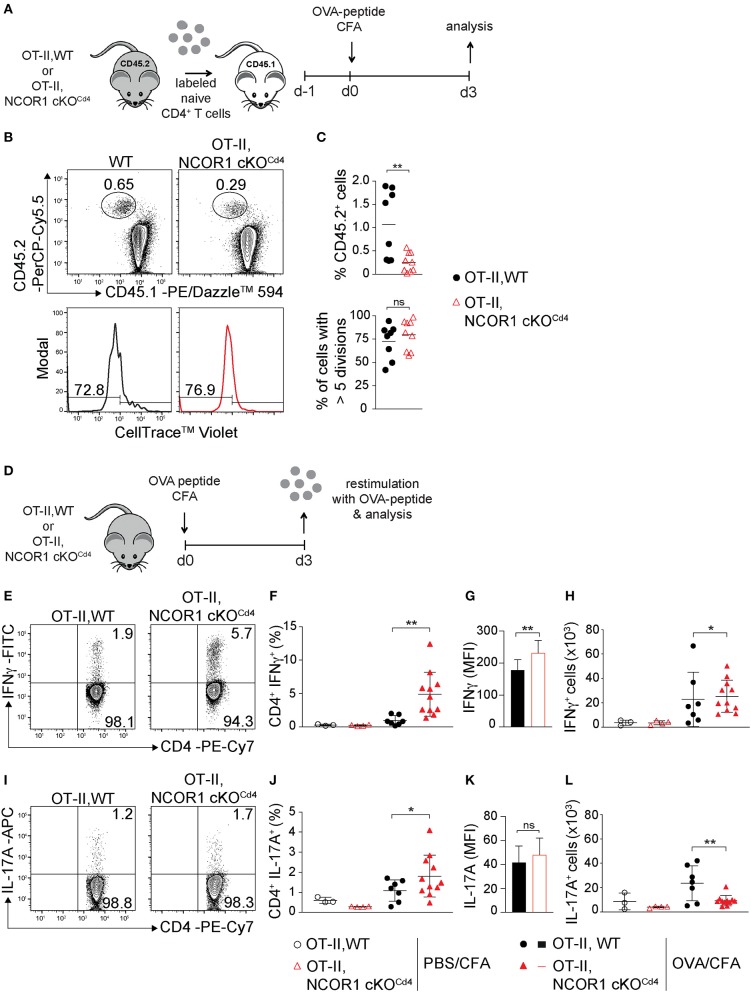
Figure 4.
IFNγ and IL-17A expression in NCOR1-deficient CD4+ T cells is increased upon in vivo short-term activation. (A) Experimental set up: Naïve OT-II,WT or OT-II,NCOR1 cKOCd4 CD4+ T cells (CD45.2+) were labeled with cell tracker dye and transferred into CD45.1+ recipient mice (day −1). Mice were immunized s.c. with OVA-peptide/CFA (day 0) and draining lymph node (dLN) cells were analyzed on day 3. (B) Contour plots (upper panel) show CD45.1+CD45.2− and CD45.1−CD45.2+ subsets in dLNs. Histograms (lower panel) depict cell proliferation dye dilution of transferred CD45.2+ T cells. Left region indicates cells that underwent >5 cell divisions. (C) Summary of all experiments performed as described in (B). Upper graph shows the percentage of CD45.2+ cells in the dLN (day 3). Lower graph shows the percentage of CD45.2+ cells that divided more than 5 times (day 3). (D) Experimental set up: OT-II,WT and OT-II,NCOR1 cKOCd4 mice were immunized s.c. with OVA-peptide/CFA. 3 days later dLNs were restimulated with OVA-peptide and analyzed. (E) Contour plots depict IFNγ production of restimulated CD4+ T cells isolated from OT-II,WT and OT-II,NCOR1 cKOCd4 mice that have been treated as described in (D). (F) Summary graph shows the percentage of IFNγ-producing CD4+ T cells in dLNs after immunization with OVA-peptide or PBS/CFA control on day 3. (G) Summary graph depicts mean fluorescence intensity (MFI) expression levels of IFNγ. (H) Summary showing cells numbers of IFNγ+ CD4+ T cells. (I) Contour plots depict IL-17A expression in restimulated OT-II,WT and OT-II,NCOR1 cKOCd4 CD4+ T cells. (J) Summary graph shows the percentage of IL-17A-producing CD4+ T cells in dLNs after immunization with OVA-peptide or PBS/CFA control (day 3). (K) Summary graph depicts mean fluorescence intensity (MFI) expression levels of IL-17A. (L) Summary showing cell numbers of IL-17A+ CD4+ T cells. (C,F,H,J,L) The horizontal bars indicate the mean. *P < 0.05, **P < 0.01, ns, not significant (unpaired two-tailed t-test or ordinary one-way ANOVA for F,H,J,L). (B,E,I) Numbers indicate the percentage of cells in the respective quadrants or regions. Data are representative (B,E,I) or show summary (C,F–H,J–L) of 8–9 (C) and 3–11 (F–H,J–L) mice that were analyzed in 3 independent experiments.

