Figure 5.
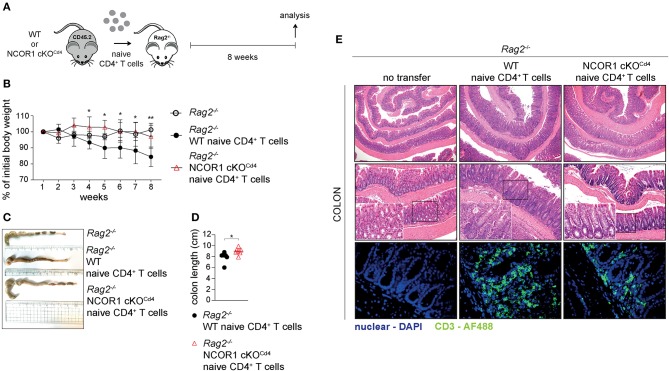
Attenuated induction of colitis by NCOR1-deficient CD4+ T cells. (A) Experimental set up: Naïve WT or NCOR1 cKOCd4 CD4+ T cells were i.p. injected into Rag2−/− mice. Eight weeks later, recipient mice were immunophenotyped and analyzed for signs of colitis. Control Rag2−/− groups did not receive any cells. (B) Diagram showing body weight during the course of the experiment. Body weight at the indicated time point was calculated relative to the initial body weight. (C) Representative pictures show colon length of Rag2−/− control mice and of Rag2−/− mice that have received either naïve WT or NCOR1 cKOCd4 CD4+ T cells. (D) Diagram shows colon length of Rag2−/− mice that have received either naïve WT or NCOR1 cKOCd4 CD4+ T cells. Length was measured without cecum. (E) Colon swiss rolls were processed for H&E stainings (upper and middle panel). The white rectangle framed pictures in the lower left corner of the middle panel pictures show a 4x magnification of the black rectangle framed section. The lower panel shows immunofluorescence stainings. Color code: blue, nuclei; green, CD3+ T cells. Magnification: H&E stainings (upper panel: 40x; middle panel: 100x; and 400x for zoomed in sections) and immunofluorescence stainings (lower panel: 400x). (D) Horizontal bar indicates the mean. *P < 0.05, **P < 0.01 (unpaired two-tailed t-test). Data are representative (C,E) or show summary (B,D) of 7–8 (B–E) mice that were analyzed in 2–3 independent experiments.

