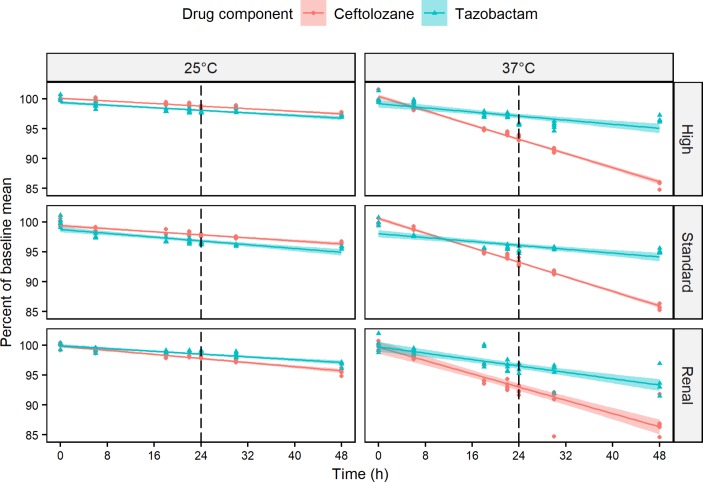
Figure 2.
Panel of scatter plots showing ceftolozane (circles) and tazobactam (triangles) concentrations expressed as per cent of baseline mean against time for each of five replicates at renal, standard and high dosing schedules incubated at either 25°C representing room temperature or 37°C for body temperature. Fitted regression lines are plotted with shaded area showing 95% CI. Dotted vertical line identifies the critical time point.

