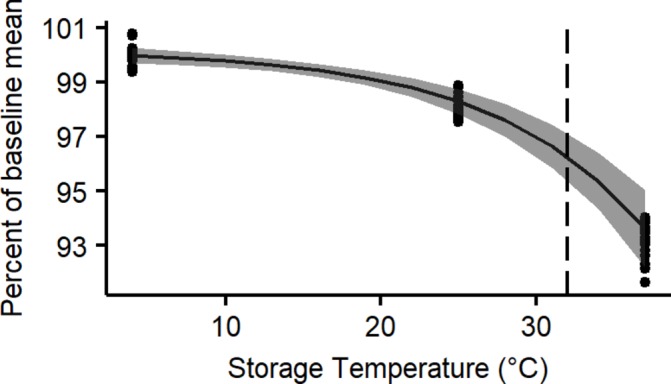
Figure 3.

Scatter plot of ceftolozane concentrations expressed as per cent of baseline mean against storage temperature at 24 hours. Fitted exponential regression line is plotted with shaded area showing 95% CI. Dotted vertical line identifies the critical temperature of 32°C.
