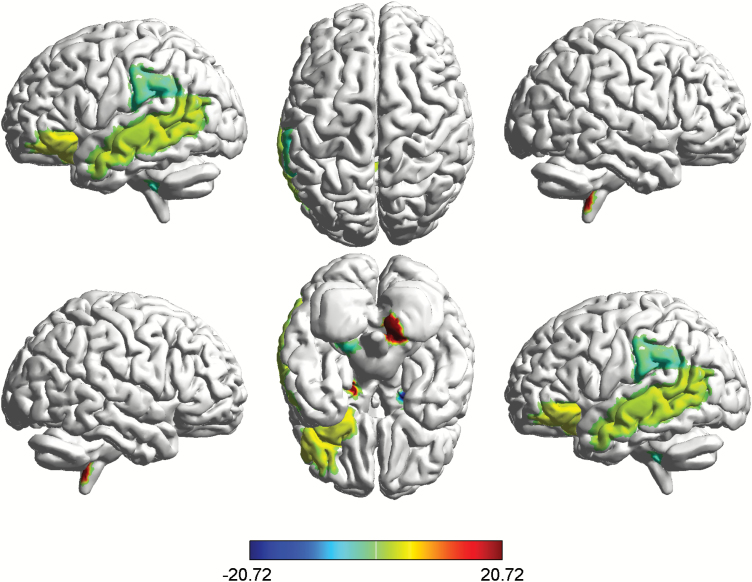
Fig. 2.
Group differences of NSS-Low and NSS-High groups in regional network characteristics. Regions with significant differences in nodal betweenness between NSS-Low and NSS-High groups. Significantly increased (hot color) and reduced (cold color) nodal betweenness were observed in NSS-High group. The results were obtained from AUC analysis across the density range of 0.11:0.02:0.5.

