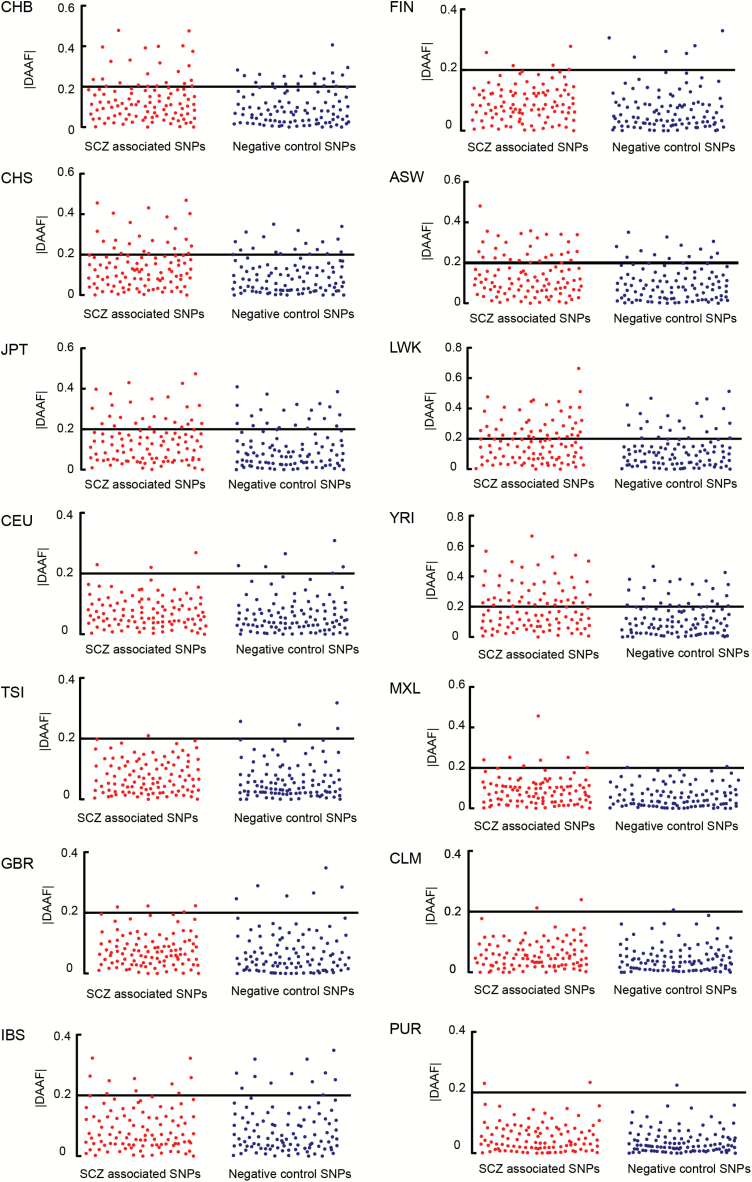
Fig. 3.
Results of the |DDAF| Test for 14 populations of 1000 Genomes Project. In the left panel, the x-axis is a list of schizophrenia-associated SNPs, while in the right panel, the x-axis refers to the negative control SNPs. The y-axis is the |DDAF| value. The bold x-axis is the threshold for the positive selection (|DDAF| > 0.2). All the statistical tests in 14 populations are detailed in supplementary table S3.

