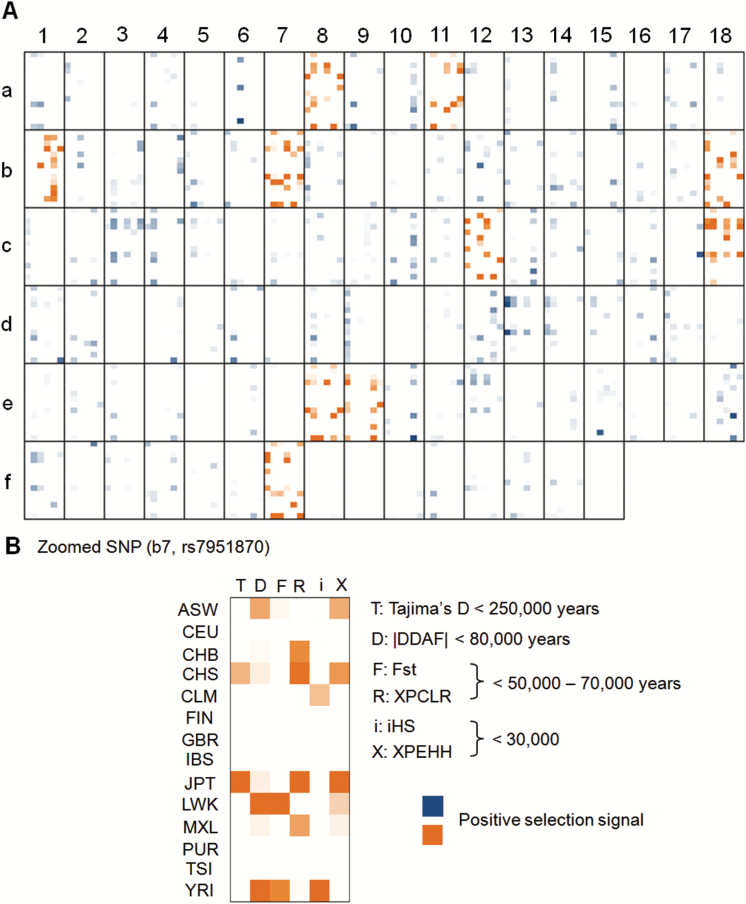
Fig. 4.
Heatmap of positive selection signals for 105 schizophrenia-associated SNPs. Each single box with border represents a single SNP (detailed information as figure 3). The coordinate of each SNP encoded by the horizontal number and vertical letter can be found in supplementary table S5.

