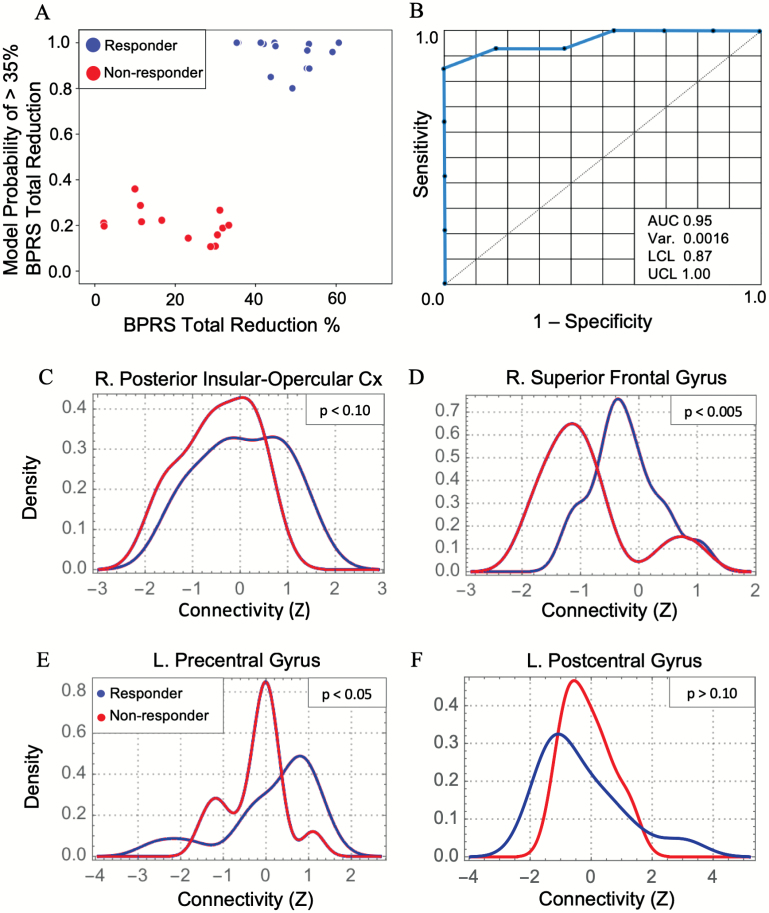
Fig. 4.
Random forest (RF) prediction of treatment response. (A) RF model probability of “response” (reduction in BPRS total score >35). (B) Receiver operating curve for the RF model. (C–F) Plots show density distributions of left anteromedial hippocampal functional connectivity with the 4 brain regions that were predictive in the RF model. P values from Kolmogorov tests of distribution equality. Var, variance; LCL, lower confidence limit; UCL, upper confidence limit; R., right; L., left; Cx, cortex; AUC, area under the curve; BPRS, Brief Psychiatric Rating Scale.

