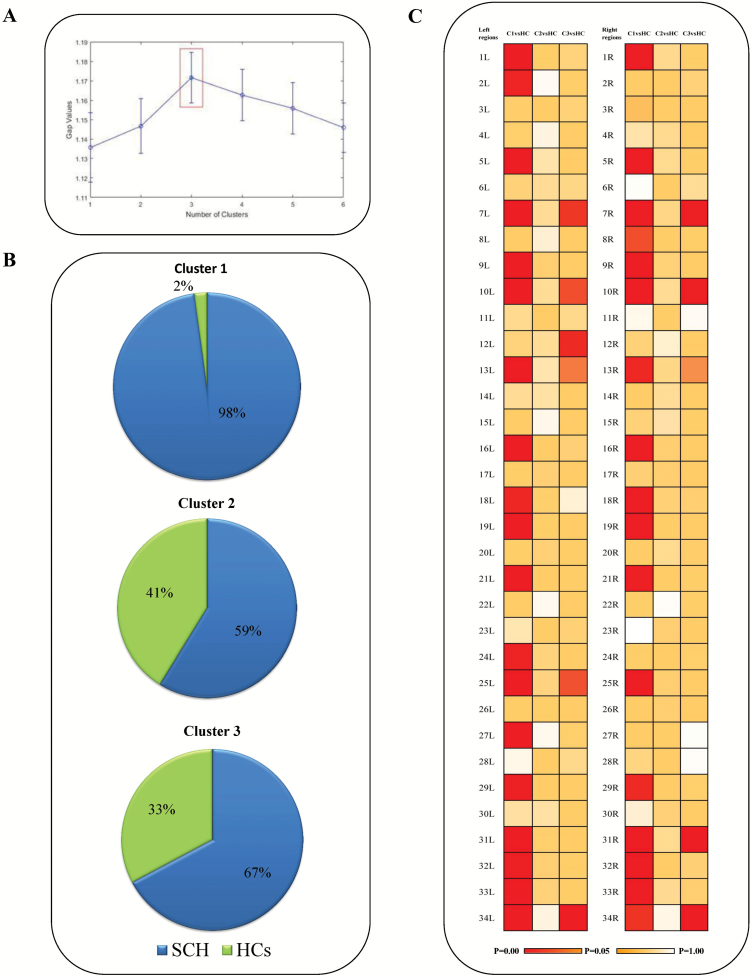
Figure 1.
(A) Gap statistic to measure the number of optimum cluster in the data set using K-means clustering. The optimal solution for the morphological data from both patients and controls is the presence of three clusters. (B) The composition of each cluster, with 98%, 59%, and 67% of each cluster being comprised of patients, is shown. (C) Different patterns of cortical thinning in three clusters of patients (Cl, C2, and C3). The age- and gender-adjusted differences between patients in each cluster and the total sample of HCs are shown by the coloured cells (with red indicating Bonferroni-adjusted P < .05). The name of the corresponding regions from the Desikan–KIlliany atlas is shown in Supplementary Table 3.

