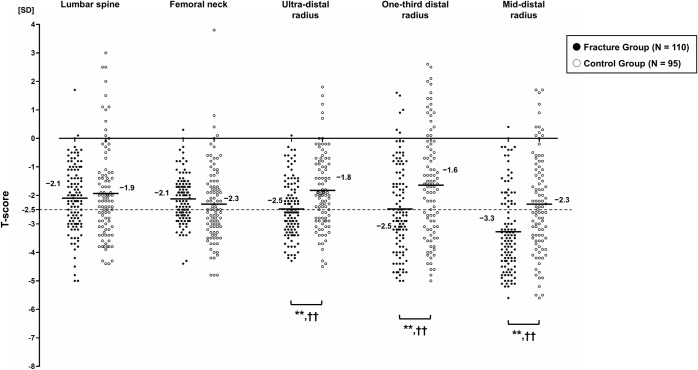
Fig. 4.
Comparison of T-score measurements between the fracture and control groups. Bars indicate mean values. The cutoff is set to −2.5 SD (dashed line). **P < 0.01; significant difference by the Mann-Whitney U test, with lower T-score for the fracture group than for the control group. ††P < 0.01; significant difference by the Pearson chi-square test, with higher proportions of patients with a T-score of ≤−2.5 SD for the fracture group than for the control group.

