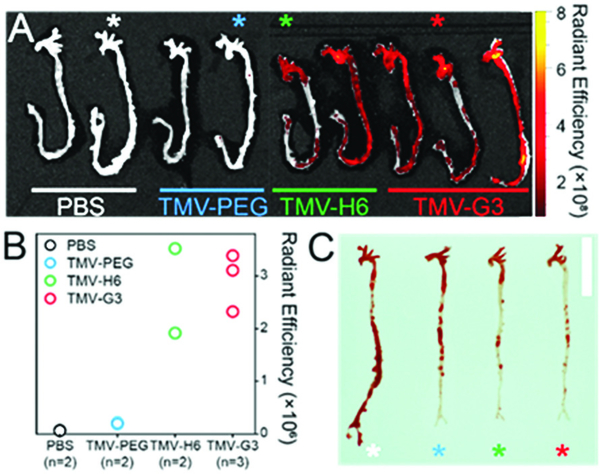
Fig. 3.
(A) Ex vivo fluorescence imaging of the aortas from ApoE−/− mice harvested 3 h post intravenous administration of TMV nanoparticles. The asterisks indicate the aortas used for Sudan IV staining in (C). (B) Quantitative analysis of ex vivo fluorescence images of (A); the total radiant efficiency was normalized to the area of interest. The radiant efficiency units are (p s−1 cm−2 sr−1)/(μW cm−2). (C) Image of aortas after Sudan IV staining. The vertical scale bar is 1 cm.

