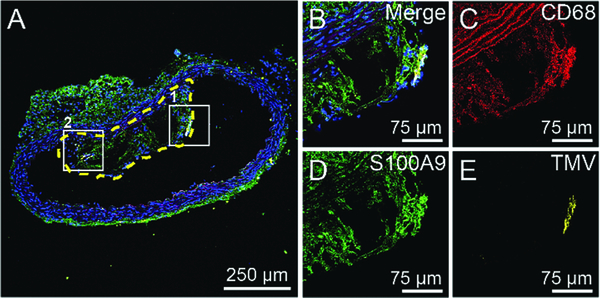
Fig. 4.
Representative confocal fluorescence image of cryosectioned aorta. (A) Aorta section from an ApoE−/− mouse injected with TMV-H6. The yellow-dashed line highlights the plaque in the lumen of the aorta. (B–E) Larger images of box 1 in (A) under different fluorescent channels: merged image with DAPI (blue), CD68 (red), S100A9 (green), and TMV (yellow). The images of box 2 are shown in in Fig. S4A (ESI†).

