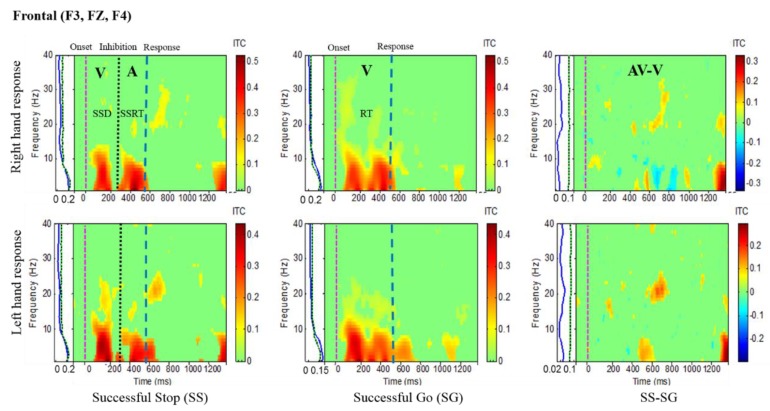
Figure 4.
Inter-trial coherence (ITC) plot of frontal cortex (F3, FZ, F4) of the brain with visual (V) and auditory (A) stimuli under left- and right-hand response inhibitions of all male subjects. Purple dashed line: Onset of the go stimulus. Black dashed line: Onset of the stop signal. Blue dashed line: Onset of response. The significant and non-significant ITC values are colored red and green, respectively. The successful go (SG) trial was elicited by only visual stimuli, and the successful stop (SS) trial was elicited by both visual and auditory stimuli. The SS-SG plots display the ITC under human inhibitory control.

