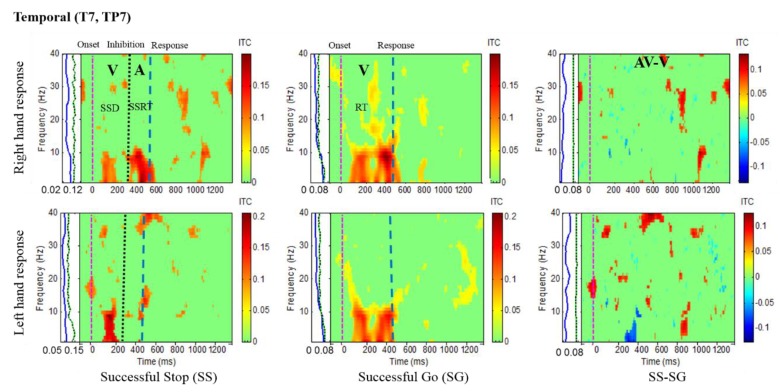
Figure 7.
ITC plot of the left temporal cortex (T7, TP7) of the brain with visual (V) and auditory (A) stimuli under left- and right-hand response inhibitions of all male subjects. Purple dashed line: Onset of the go stimulus. Black dashed line: Onset of the stop signal. Blue dashed line: Onset of response. The significant and non-significant ITC values are colored red and green, respectively. The SS-SG plots display the ITC under human inhibitory control.

