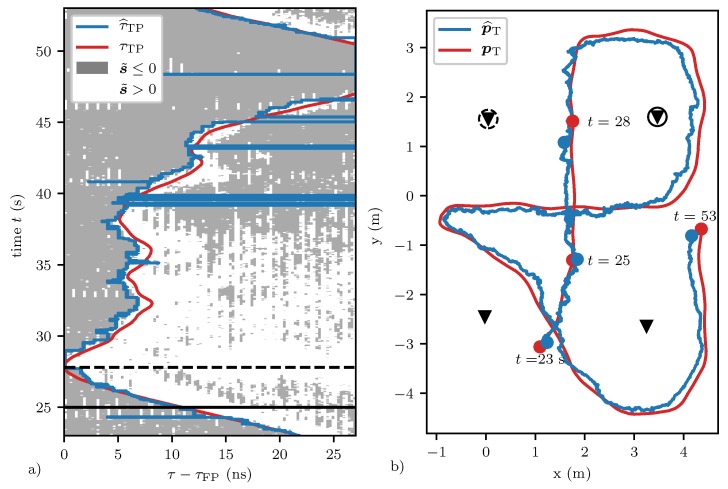
Figure 7.
Plot (a) shows the measured and ground truth target path location in blue and red, respectively. The transmitter and receiver of the corresponding CIR are marked in plot (b) and also in Figure 4 with a dashed and solid circle, respectively. Plot (b) also shows the corresponding ground truth target position and the estimated target position in red and blue, respectively. The target path location is measured by performing a leading edge detection on the background subtracted variance metric (as defined in Equation (13)). Segments where is positive and negative are shown in plot (a) in white and gray, respectively. Note that sometimes the algorithm fails to detect the leading edge, e.g., at . The solid black horizontal line at marks the time of the data shown in plot (b) of Figure 3, Figure 4 and Figure 6. The dashed black horizontal line at marks the time when the target position was between the marked transmitter and receiver, i.e., when .

