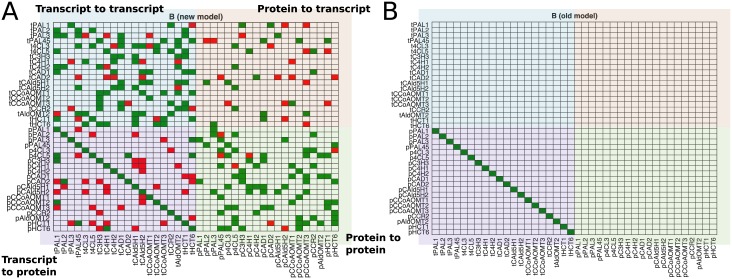
Fig 5. Heatmaps of the relationships in the transcript-protein models.
(A) Heatmap of the edge matrix B (Eq 3) solved using a sparse maximum likelihood estimator. Green for positive influence, red for negative influence. Edges are from columns to rows (e.g., the first row shows edges tPAL3 → tPAL1, tCCR2 → tPAL1, tHCT6 → tPAL1, pC3H3 → tPAL1, pCAD2 → tPAL1, pCAld5H2 → tPAL1, and pCCoAOMT3 → tPAL1). There were 295 edges detected out of a possible 1540 (19.16% sparse). (B) The corresponding heatmap for the relationships considered in the old model (ti → pi).

