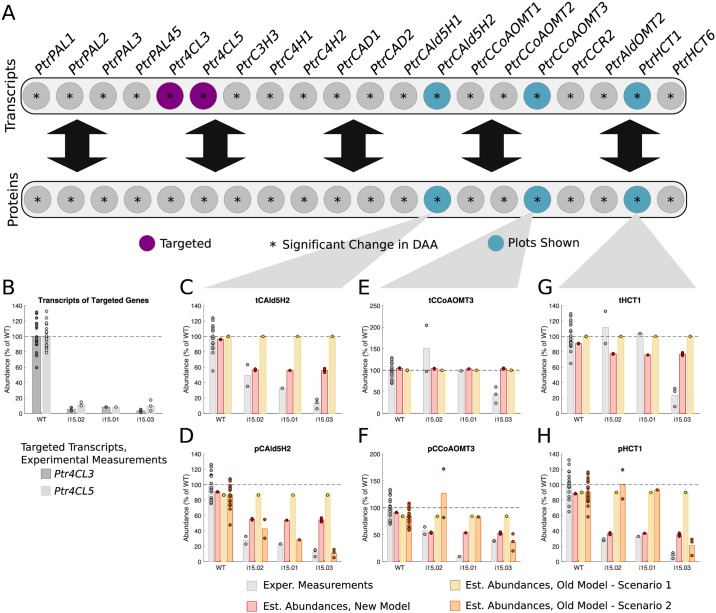
Fig 9. Experimental and estimated abundances of untargeted monolignol gene transcripts and proteins under Ptr4CL3 and Ptr4CL5 knockdowns.
(A) Diagram showing targeted monolignol gene transcripts (purple), the transcripts and proteins that were found to have a significant change in abundance in at least one of the experimental lines (*). (B) Level of knockdown of the targeted gene transcripts across the experimental lines. Experimental and estimated untargeted monolignol gene transcript and protein abundances for (C) tCAld5H2, (D) pCAld5H2, (E) tCCoAOMT3, (F) pCCoAOMT3, (G) tHCT1, and (H) pHCT1.

