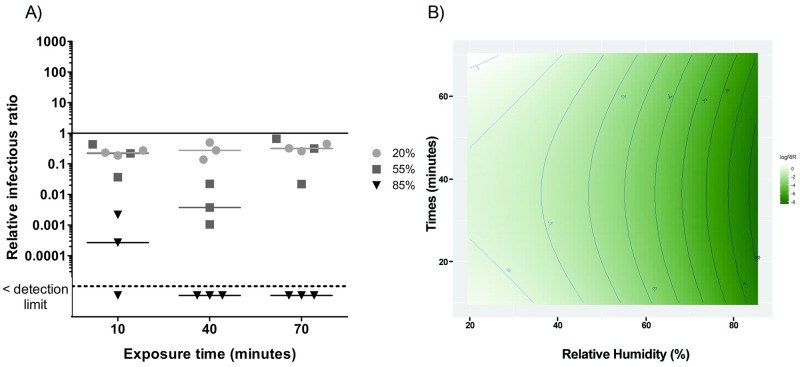
Fig 3.
A) Ozone effect on phage φX174 infectivity at three levels of relative humidity and three exposure times. The solid line represents the reference value without ozone. The dotted line represents the detection limit. 20% RH values are represented by circles (●), 55% RH by squares (■) and 85% RH by triangles (▼). B) RSM between exposure time and humidity percentages for φX174. The darker the green colour, the greater the inactivation related to relative humidity and time combination.

