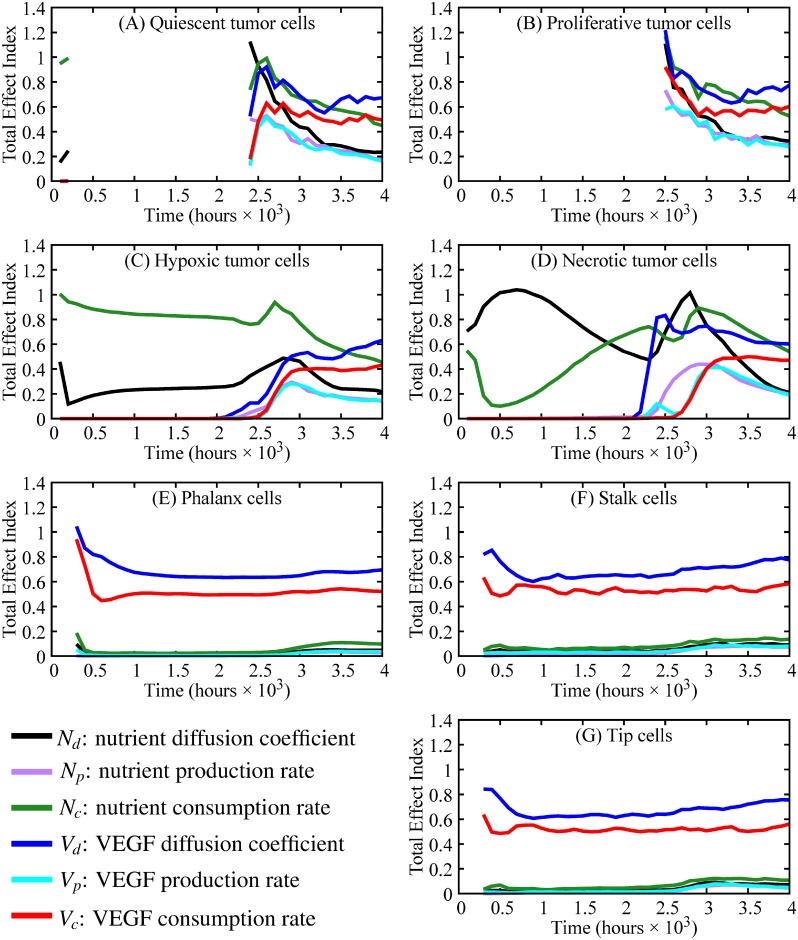
Fig 11. Sensitivity analysis for different tumor cell phenotypes and parameters (black = nutrient diffusion, purple = nutrient production, green = nutrient consumption, blue = VEGF diffusion, cyan = VEGF production, red = VEGF consumption).
Panels A-G show the total effect index over time of cell phenotypes with Panels A-D depicting tumor cell phenotypes and Panels E-G depicting endothelial cell phenotypes. The gaps in the total effect index (TEI), most predominantly shown in Panels A and B, occur because TEI is calculated when changes in cell number occur through time (e.g., the number of proliferative tumor cells in Panel B is constant from hour 0 to hour 2900, so there is no TEI). In the beginning stages of tumor growth (hours 0-2500), the nutrient diffusion and nutrient consumption are the most important parameters in tumor composition (i.e., small changes in these parameters would yield large changes in tumor composition). However, after the initiation of angiogenesis and the formation of anastomotic loops, nutrient consumption and VEGF diffusion are the main drivers of tumor composition. Throughout the entire simulations, the most important parameters for angiogenesis and vessel maturation (i.e., vessel growth and anastomosis formation) are VEGF diffusion and consumption.

