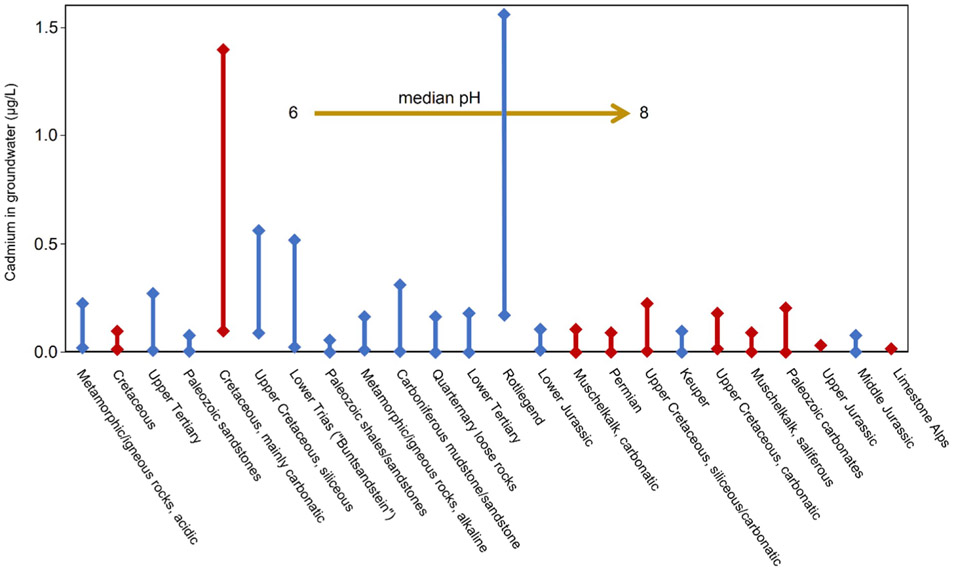
Fig. 1.
Cadmium concentrations in groundwater related to stratigraphic and petrographic aquifer features (BGR, 2014). Bars represent 50th percentile (lower edge) and 90th percentile (upper edge) of Cd in groundwater. Red bars show limestone dominated aquifers, blue bars show miscellaneous aquifer material. Aquifer's order indicate median pH in groundwater from acidic (left) to alkaline (right). (For interpretation of the references to colour in this figure legend, the reader is referred to the Web version of this article.)

