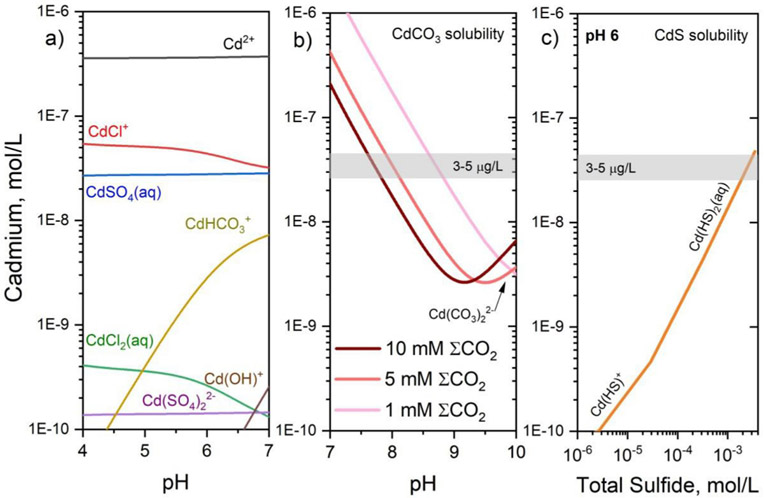
Fig. 4.
Concentration versus pH diagrams showing a) Cd speciation from pH 4 to 7 for the composition Cd (10−6.4 M), Cl (10−3 M), ΣCO2 (10−3 M), and SO4 (10−3 M). b) Otavite solubility as a function of pH and Σ CO2 from 10−3 to 10−2 M. C) Concentration versus dissolved sulfide diagram showing the solubility of CdS at pH 6. Reference concentrations for drinking water standards are shown (3 to 5 μg/L).

