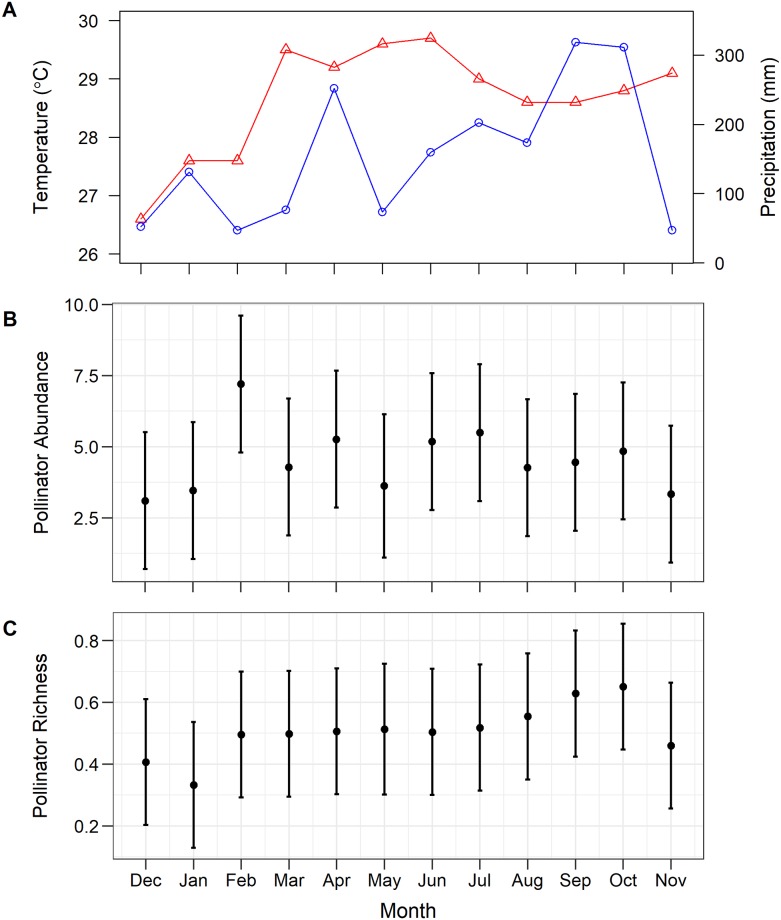
Fig 1. Temporal variation in weather and pollinator communities in Bangkok, Thailand over 12 months (December 2017—November 2018).
(A) Average monthly temperature (triangles, red line) and total monthly precipitation (circles, blue line). Neither (B) pollinator abundance nor (C) pollinator species richness varied significantly across months; points and error bars represent mean ± SE.

