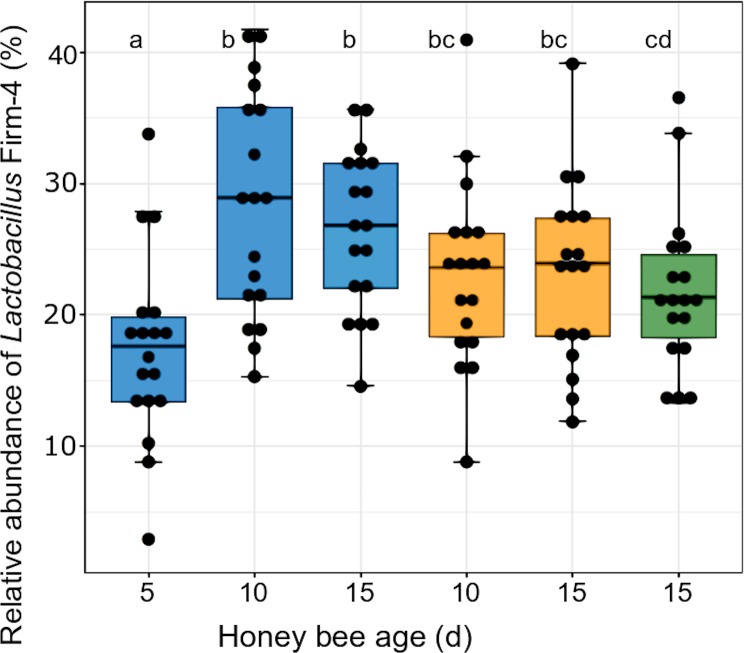
Fig 5. Relative abundance of Lactobacillus Firm-4 in the gut microbiota.
The three treatment groups are highlighted with different colours: control (blue), melezitose (yellow) and melezitose from day 10 (green). Significantly different groups are highlighted by the letters a, b, c and d (F-statistic: 4.245 on 5 and 102 DF, p = 0.002). For each treatment group and each bee age, 18 individuals were used for analysis. The vertical boxplots depict the interquartile range (lower bound/ upper bound of the box correspond to the 25%/ 75% quantile), the median (horizontal line in the box) and outlying observations (points outside the box).

