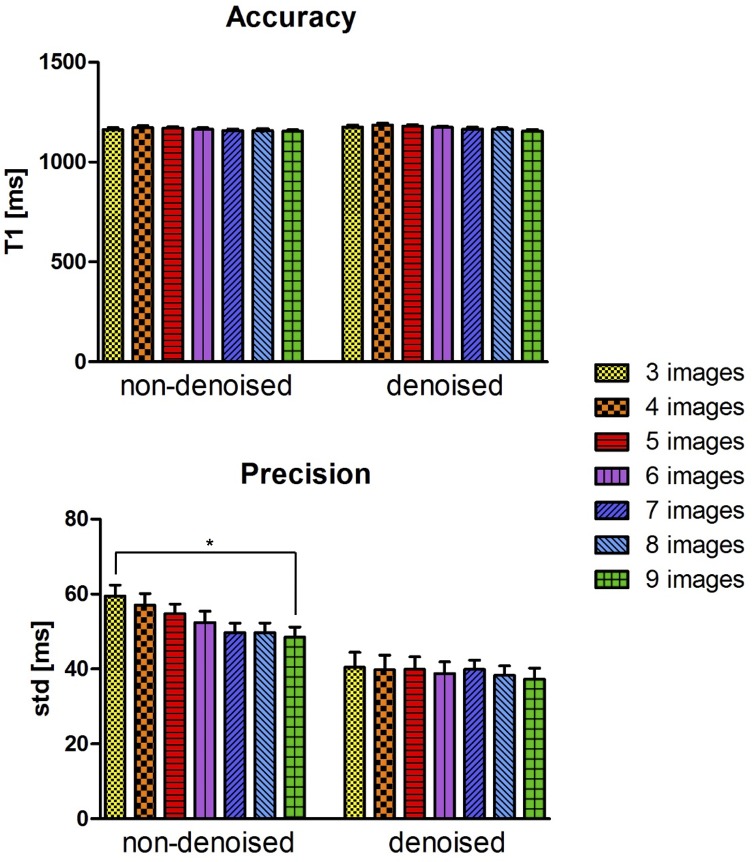
Fig 4. Accuracy and precision averaged between the ten healthy subjects for the retrospective study (3 to 9 images considered for T1 mapping).
A ROI was manually drawn in the septum of the myocardium in the mid slice of the 3D SASHA T1 maps before (non-denoised) and after (denoised) denoising. Statistical significance difference is indicated by * (p value < 0.045).

