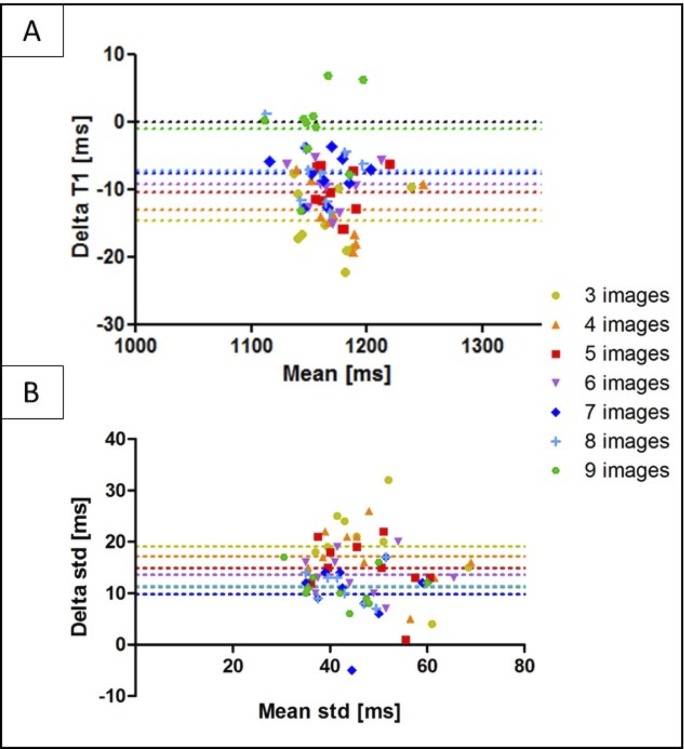
Fig 5.
Bland-Altman plot of the accuracy (A) and precision (B) of the non-denoised vs. denoised 3D SASHA using three to nine T1-weighted images for imaging, indicated with different colors in the figure. The x-axis shows the mean between the measurements of the non-denoised and denoised 3D SASHA, while the y-axis shows the difference (delta T1) between the two measurements. The bias of each measurement is also indicated in the plot.

