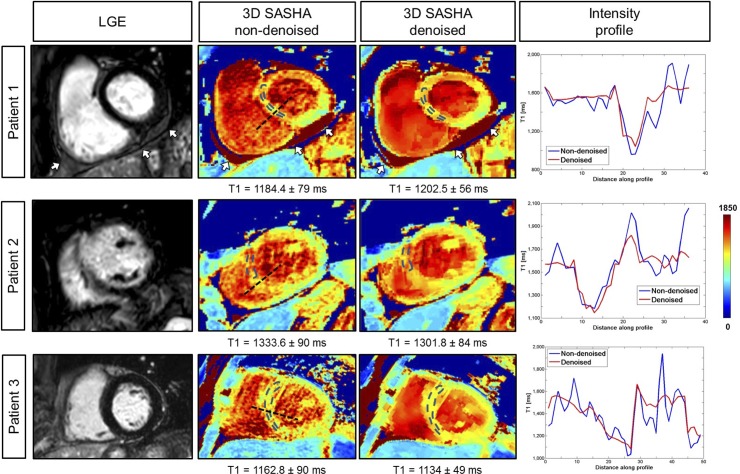
Fig 10. 3D SASHA T1 maps before (non-denoised) and after (denoised) denoising and corresponding LGE image for three patients.
For each patient, the intensity profiles across the blood and the myocardium of the T1 maps non-denoised (in blue) and denoised (in red) are shown. Patient 1 presented with pericarditis, indicated by the white arrow. Patient 2 had ischemia in the mid-apical septum-anterior wall with corresponding elevated myocardial T1 on the 3D SASHA T1 maps. Patient 3 did not present with disease, which was confirmed by the measured myocardial T1 values.

