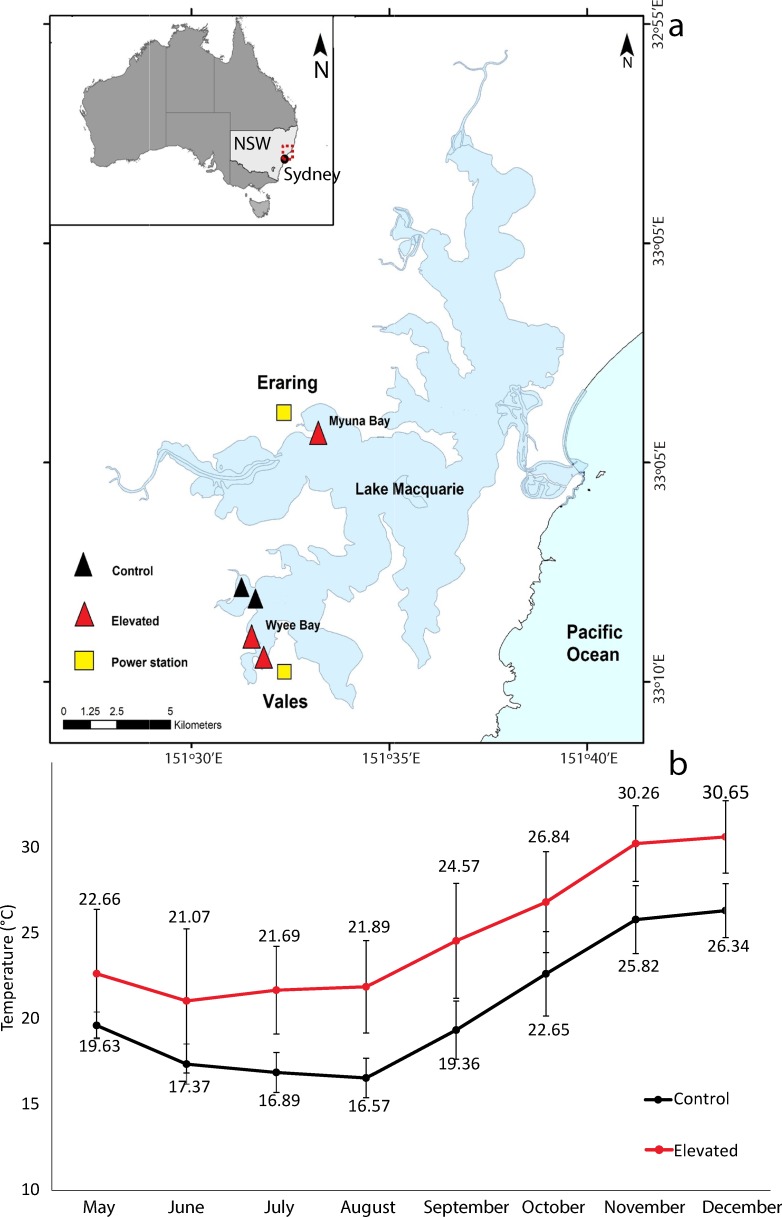
Fig 1. Map of study location and temperatures over study period.
a) Map of Lake Macquarie, New South Wales (NSW), with map a of Australia (top left) showing the field locations where the baskets were deployed and then retrieved following approximately seven months. Yellow squares represent the warm seawater outfall of two power stations (Eraring and Vales power stations). Black triangles are the ambient (control) locations and the red triangles are the elevated locations (total 5 baskets). b) Mean monthly temperatures ± S.D. at control (ambient) and elevated temperature locations in Lake Macquarie, NSW from May to December 2018 (approximately seven months). Temperature data was measured every 30 minutes at 1.10m depth.

