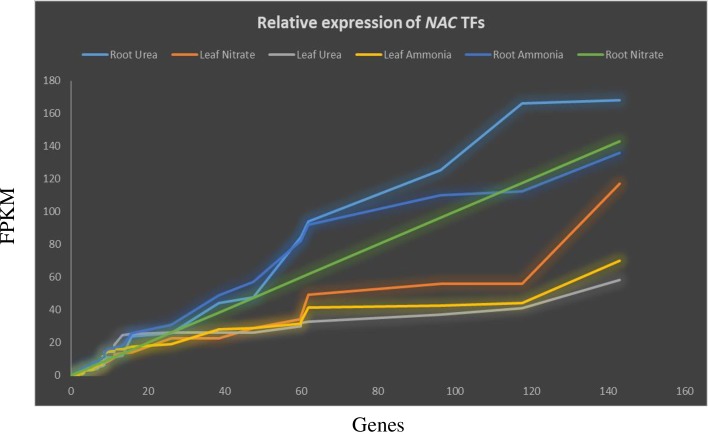
Fig 6. Differential expression of NAC TFs in leaves and roots of A. thaliana plants treated with ammonia, nitrate, and urea.
The expression of A. thaliana NAC TFs was analysed to determine their response to different sources of nitrogen. Urea and ammonia in root tissue show higher expression level whereas urea treated leaf tissue showed low level of NAC expression. The expression data were obtained from the PhytoMine database in Phytozome and presented as FPKM (Fragments per Kilobase of transcripts per million mapped reads). The X-axis represents the NAC TF genes and Y-axis represent the Fragments per Kilobase of transcripts per million mapped reads.

