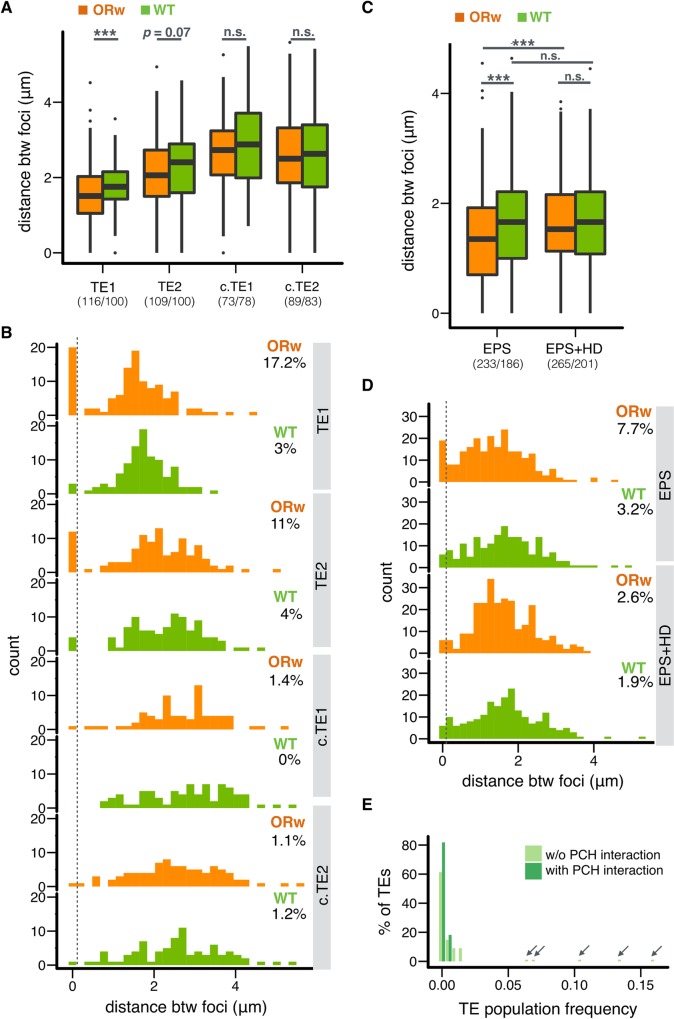
Fig 4. Euchromatic TEs show 3D contacts with PCH, and such interactions are sensitive to 1,6-hexanediol treatment.
(A, B) Boxplot (A) and histogram (B) showing the 3D distance between euchromatic TE neighborhood and PCH on optical sections. The distance was estimated for ORw1118 (ORw, orange, TE present) and wild type (WT, green, no TE present) embryonic cells. (C, D) Boxplot (C) and (D) histogram comparing TE1-PCH distance between genotypes and between treatments. The distance was estimated for permeabilized ORw and WT embryos (EPS, see Materials and Methods) and permeabilized ORw and WT embryos with 1,6-hexanediol treatments (EPS+HD). In (A, C), the numbers of nuclei counted are in parentheses. In (B, D), the threshold for nuclei with overlapping foci is denoted with a dashed line, and the percentages denote nuclei with overlapping foci. (E) Population frequencies of TEs with and without PCH interaction. Note that high frequency TE insertions (population frequency > 0.05, arrows) all show no PCH interactions. In (A, C), Centerlines: median, box limits: upper and lower quartile. Points: outliers. *** p < 0.001, n.s p > 0.05.

