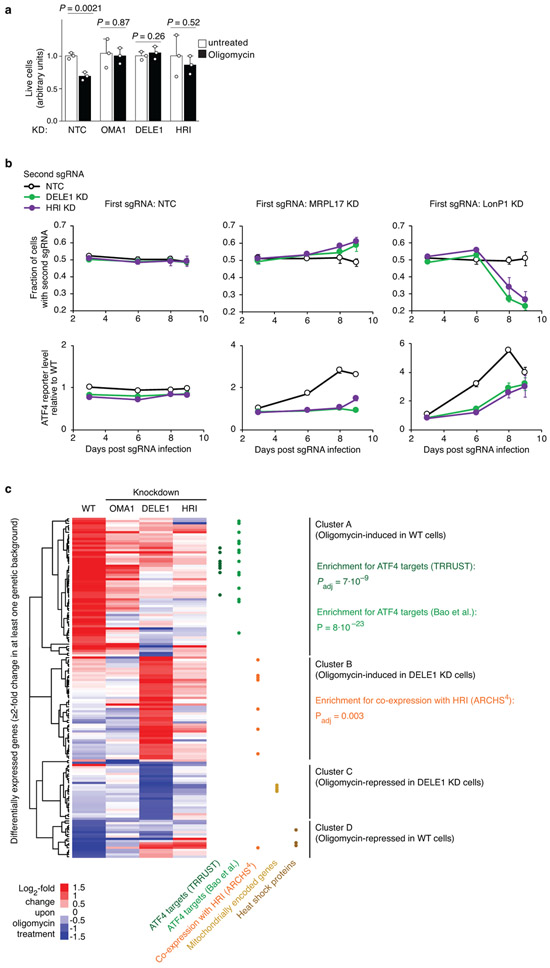
Extended Data Figure 7. The DELE1-HRI pathway can be maladaptive and its blockade induces an alternative program.
(a) OMA1, DELE1, HRI knockdown is protective during oligomycin treatment. HEK293T cells expressing non-targeting control sgRNA (NTC) or an sgRNA knocking down HRI, DELE1 or OMA1 were untreated or treated with 2.5 ng/mL oligomycin for 16 h, and cell numbers were determined by counting (mean ± s.d., n = 3 culture wells, P values were determined by two-tailed unpaired t test).
(b) HRI knockdown is protective for cells with depleted mitochondrial ribosomal protein MRPL17, but sensitizes cells with depleted mitochondrial protease LonP1. HEK293T cells were co-infected with lentiviral construct expressing green fluorescent protein and an sgRNA knocking down HRI, and with a lentiviral construct expressing blue fluorescent protein and a non-targeting control sgRNA (NTC) or an sgRNA knocking down MRPL17, MRPL22, or LONP1. Cells were cultured for 9 days and proportions of cells expressing green and blue fluorescent proteins were quantified on days 3, 6, 8 and 9 post infection by flow cytometry (top). Thus, the effect of HRI knockdown on proliferation in different genetic backgrounds could be evaluated in an internally controlled experiment. In parallel, the ATF4 reporter was quantified (bottom). Mean ± s.d., n = 3 culture wells.
(c) HEK293T cells that were either infected with a non-targeting control sgRNA or in which OMA1, DELE1 or HRI was knocked down were untreated or treated with 1.25 ng/mL oligomycin for 16 h, and transcriptomes were analyzed by RNA sequencing for n = 3 independent experiments. Differentially expressed genes and P values were determined as described in the Methods (full datasets in Supplementary Tables 2,5-7). The heatmap only includes genes expression of which changed significantly upon oligomycin treatment (Padj < 0.05) by at least two-fold in at least one genetic background. Hierarchical clustering reveals four major gene clusters. Gene groups are indicated by dots in different colors: ATF4 targets annotated by the TRRUST database (dark green, Padj value calculated by Enrichr) or Bao et al.1 (light green, P value calculated by Fisher’s exact test), genes co-expressed with HRI in the ARCHS4 database (orange dots, Padj value calculated by Enrichr), mitochondrially encoded genes (golden dots), heat-shock proteins (brown dots).

