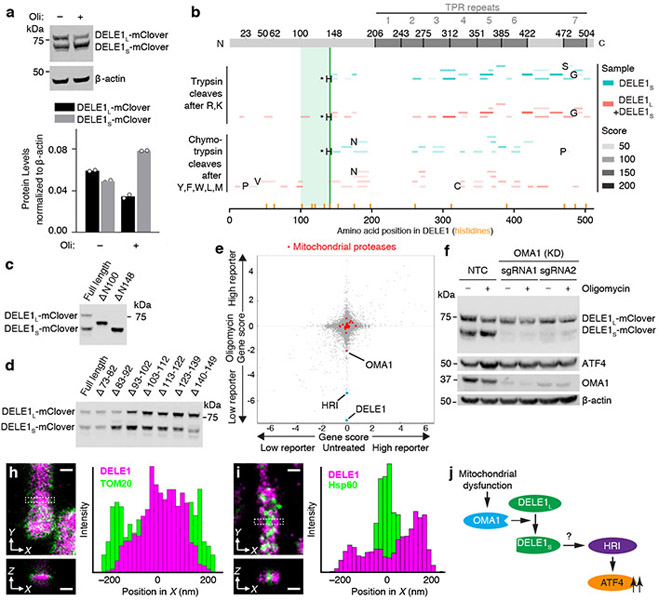
Fig. 3. A cleaved form of DELE1 accumulates upon mitochondrial stress in an OMA1-dependent manner.
(a) Cells stably expressing DELE1-mClover were treated with 1.25 ng/mL of oligomycin for 16 h. Two DELE1-mClover isoforms (DELE1L and DELE1S) were detected using an anti-GFP antibody. Top, representative blot. Bottom, quantification of n = 2 blots.
(b) Tryptic and chymotrypic peptides of total DELE1 (red) or DELE1S (cyan) detected by mass spectrometry mapped to the amino acid sequence of DELE1. DELE1S lacks peptides derived from the N-terminal 141 amino acids; the light green box indicates the putative cleavage region. Peptides resulting from cleavage at residues that are not canonical targets of trypsin or chymotrypsin, respectively, are labeled with the amino acid N-terminal to the cleavage event. Peptides resulting from cleavage after histidine-142 are labeled with asterisks, and this position is marked with a solid green line. Positions of all histidines in the DELE1 sequence are labeled with orange lines.
(c,d) Immunoblot from cells transiently expressing full-length DELE1-mClover and truncation constructs lacking the indicated amino acids. Similar results in n = 2 independent experiments.
(e) Comparison of gene scores (defined in Methods) from the genome-wide CRISPRi screen in untreated and oligomycin-treated conditions. Highlighted in red are mitochondrial proteases, of which OMA1 knockdown significantly reduces ATF4 activation by oligomycin.
(f) Immunoblot of DELE1-mClover, ATF4 and OMA1 in cells expressing non-targeting control sgRNAs (NTC) or OMA1 sgRNAs, which were treated with 1.25 ng/mL of oligomycin for 16 h where indicated. Similar results in n = 2 technical replicates.
(g-h) Two-color 3D-STORM super-resolution microscopy. Magenta: stably expressed DELE1-mClover, Green: outer mitochondrial membrane protein TOM20 (g) or mitochondrial matrix protein Hsp60 (h). Virtual cross-sections and spatial intensity distributions are shown for the boxed area. Scale bars: 250 nm. Similar results in n = 3 independent experiments.
(i) Model.

