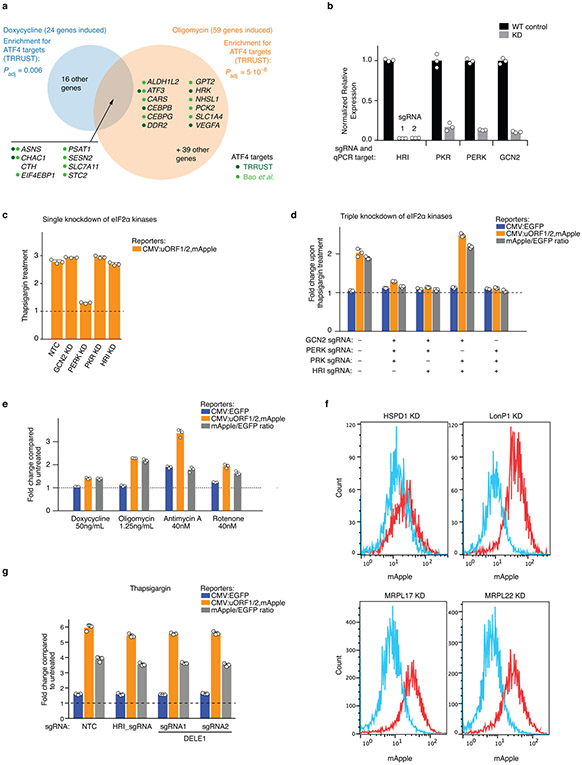
Extended Data Figure 1. Induction of ATF4 target genes under mitochondrial stress conditions and characterization of the ATF4 translational reporter.
(a) HEK293T cells were treated with 50 μg/mL doxycycline or with 1.25 ng/mL of oligomycin for 16 h, and transcript levels were compared to untreated cells using RNA-Seq for n = 2 (doxycyclin) or n = 3 (oligomycin) independent experiments. Differentially expressed genes and P values were determined as described in the Methods (full datasets in Supplementary Tables 1,2). This Figure analyzes significantly induced genes (Padj < 0.05) with at least a 2-fold increase in treated over untreated conditions. Enrichment analysis for targets of transcription factors annotated in the TRRUST database57 (statistical analysis described in the Methods) detected ATF4 as the only significant transcription factor (Padj < 0.05) for both treatments. Genes induced by both treatments are listed, as well as genes annotated as ATF4 targets in TRRUST (dark green dots) or Bao et al.1 (light green dots).
(b) Quantification of the knockdown efficiency of sgRNAs targeting the eIF2α kinases by Quantitative RT-PCR (n = 3 technical replicates). For HRI, two independent sgRNAs, 1 and 2, were characterized.
(c, d) Validation of the reporter cell line using endoplasmic reticulum stressor, tharpsigargin (Tg). Reporter cells expressing either individual or triple sgRNAs targeting the indicated eIF2α kinases were exposed to 75 nM Tg for 8 h before measuring reporter levels by flow cytometry. The induction of ATF4 reporter by Tg is blocked by PERK knockdown. The reporter fold change was quantified as in Fig. 1b (mean ± s.d., n = 3 culture wells).
(e) Pharmacological inhibition of mitochondrial function, using the mitochondrial ribosome inhibitor doxycycline, the electron transport chain inhibitors antimycin A and rotenone, and the ATP synthase inhibitor oligomycin, induces the ATF4 reporter. Reporter cells were exposed to the indicated treatments for 16 h before measuring reporter levels by flow cytometry. The reporter fold change was quantified as in Fig 1b (mean ± s.d., n = 3 culture wells).
(f) CRISPRi knockdown (KD) of factors required for mitochondrial protein homeostasis (HSPD1 and LONP1) and mitochondrial ribosomal proteins (MRPL17 and MRPL22) (red) induce the ATF4 reporter compared to WT cells (blue). Similar results obtained in n > 3 independent experiments.
(g) DELE1 and HRI are not required to trigger the integrated stress response in response to ER stress. Reporter cells expressing non-targeting control sgRNAs (NTC) or sgRNAs targeting HRI or DELE1 were exposed to 75 nM thapsigargin for 8 h before measuring reporter levels by flow cytometry. The reporter fold change (mean ± s.d., n = 3 culture wells) is the ratio of median fluorescence values for thapsigargin over untreated samples.

